A practitioner’s architecture and maturity model for end-to-end observability across a hybrid estate — AWS-native applications, second- and third-party clouds, on-premises datacenters, and VM-hosted SaaS integrations — built on AWS-native observability services.
Most enterprises do not have an observability problem. They have five observability problems, one per estate boundary, each solved by a different tool bought at a different time by a different team — and no shared identity for the thing being observed. This article is about collapsing those five into one signal plane on AWS, and then earning the right to put agents on top of it.
1. Why the hybrid estate breaks classical monitoring
A representative enterprise estate in 2026 looks like this: containerised microservices on EKS; a long tail of EC2 and Lambda; a second cloud footprint that arrived with an acquisition; a datacenter running the ERP and the mainframe gateway that nobody is allowed to touch; and — the part that quietly causes the most incidents — a dozen vendor SaaS products deployed as customer-hosted virtual appliances, integrating over private connectivity, emitting proprietary logs and no traces at all.
Classical monitoring assumes three things that none of these boundaries respect:
- That the failure domain is a host. It is not. It is a request path that crosses six ownership boundaries and two network fabrics.
- That you know in advance what to measure. Threshold alarms encode last year’s outages. Novel failure modes — the ones that actually page you at 3am — are by definition unenumerated.
- That the tool boundary matches the org boundary. The infra team’s dashboard, the app team’s APM, and the network team’s NMS are three disjoint views of one transaction. The correlation happens in a human head on a bridge call, at a rate of roughly one hypothesis every four minutes.
The engineering goal is therefore not “more dashboards.” It is a single, queryable entity graph — services, dependencies, hosts, deployments, and customer journeys — with all four telemetry signals attached to it and the same identity used on every side of every boundary. Everything else in this article is in service of that.
The framing that matters: Monitoring answers “is it broken?”. APM answers “which tier is slow?”. Observability answers “why is this specific request behaving unlike the others?” — a question you did not pre-register. AIOps answers it before you ask. Agentic operations then acts on the answer. Each step is a strictly harder data problem, and you cannot skip one.
2. The maturity model: L0 → L4
Maturity models are usually marketing. This one is useful only because each level has a hard technical entry gate — a data property you either have or you don’t. If you don’t meet the gate, the level above produces confident nonsense.
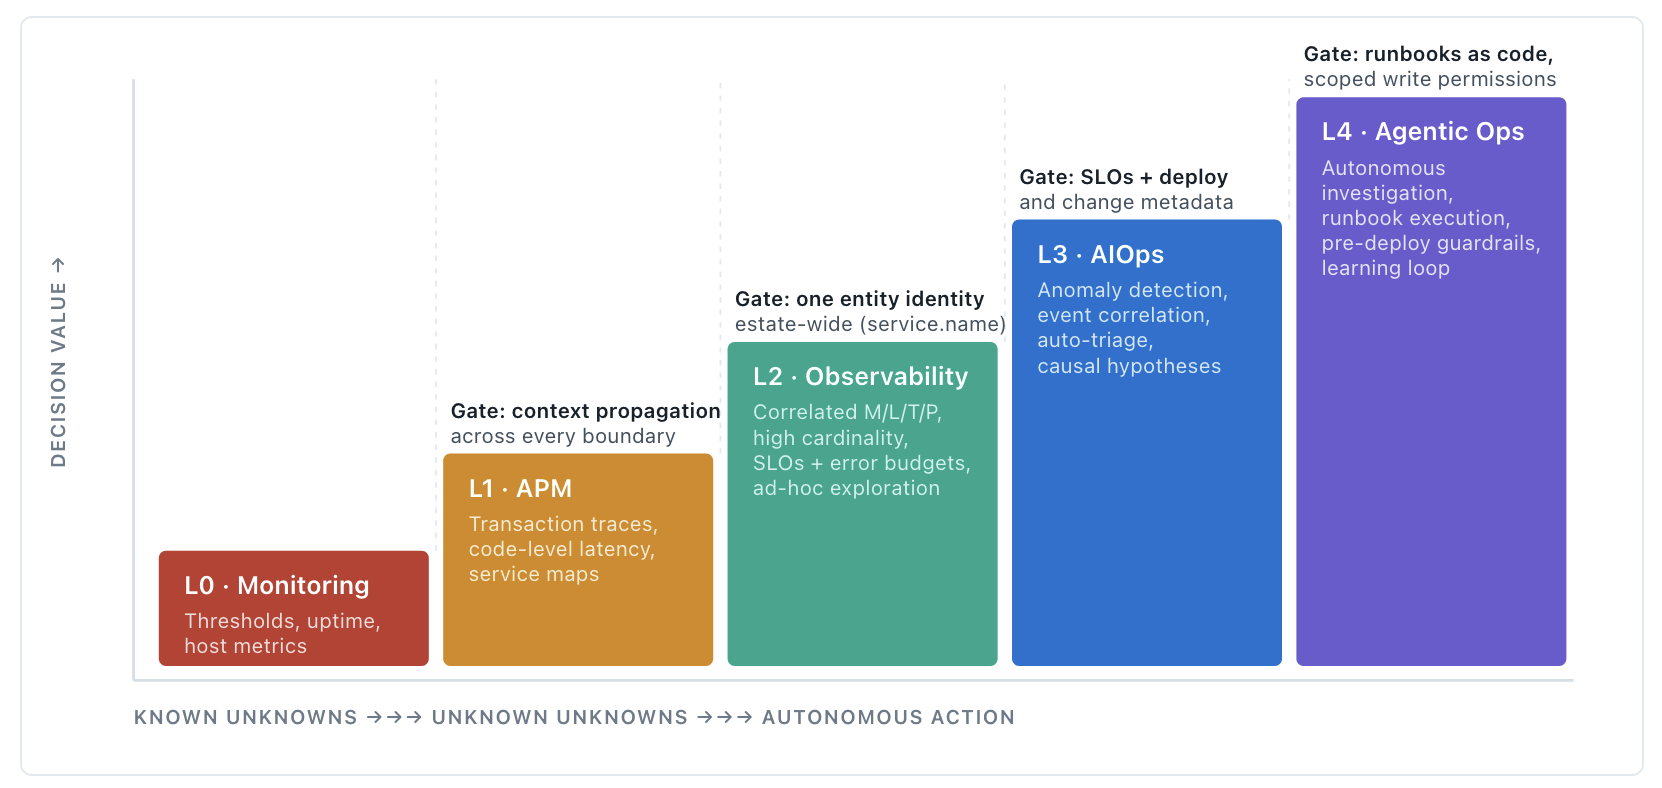
The levels, with their AWS expression
| Level | Question it answers | Data property required | AWS-native expression |
|---|---|---|---|
| L0 Monitoring | Is the component up, and is a known metric outside a known bound? | Agent coverage and a metric namespace. Cardinality is low by design. | CloudWatch agent on EC2 and on-prem hosts, vended service metrics, CloudWatch alarms, Synthetics canaries, Personal Health Dashboard. |
| L1 APM | Which tier, dependency, or code path is contributing the latency or errors? | Trace context propagates end to end. A break anywhere truncates the map. | ADOT / OTel auto-instrumentation, X-Ray as trace backend, CloudWatch Application Signals for service-level golden signals, Transaction Search for span-level retrieval. |
| L2 Observability | Why is this request, tenant, or region behaving differently — a question nobody pre-registered? | One identity per entity across all four signals, plus high-cardinality retention. | Native OTLP metrics in CloudWatch with PromQL, Logs Insights (JOIN, sub-query, lookup), AMP for Prometheus-native workloads, AMG as the multi-cloud pane, OpenSearch for long-retention forensics. |
| L3 AIOps | What changed, what is anomalous, and what are the three most likely causes? | SLOs and change/deploy metadata joined to the entity graph. | CloudWatch anomaly detection, Application Signals SLOs and SLO recommendations, CloudWatch investigations, Database Insights on-demand analysis, log anomaly detection. |
| L4 Agentic Ops | Can the system investigate, propose, and — within a blast radius — execute the fix? | Machine-readable runbooks, tool access, and explicitly scoped permissions. | AWS DevOps Agent (GA March 2026) with custom SRE agents, MCP and A2A integration, CloudWatch and Application Signals MCP servers, SSM Automation as the actuator. |
The most common failure: Organisations buy L3 and L4 capability while sitting on L0 data. Anomaly detection over uncorrelated host metrics produces a high-volume stream of statistically true, operationally useless alerts. An investigation agent pointed at an estate with three competing definitions of “service” will confidently investigate the wrong service. The gates are load-bearing.
3. The 2026 inflection: OpenTelemetry as the estate contract
For a hybrid estate the single most consequential architectural decision is what the wire format is at the boundary between “things we run” and “the observability backend.” Until recently that answer differed per environment: CloudWatch EMF on AWS, Prometheus scrape on Kubernetes, X-Ray segments for traces, syslog from the datacenter, and whatever the SaaS appliance felt like emitting.
2026 closed that gap decisively, and the two changes are worth stating precisely because they change designs:
- AWS X-Ray SDKs and the X-Ray daemon entered maintenance mode on 25 February 2026, with end of support on 25 February 2027. The X-Ray service — console, trace store, backend processing — continues unchanged; it is the instrumentation layer that is being retired in favour of OpenTelemetry via ADOT. Practically: any greenfield instrumentation on X-Ray SDKs in 2026 is technical debt on a dated fuse.
- Native OpenTelemetry metrics in CloudWatch reached GA in June 2026, with a regional OTLP endpoint, PromQL querying alongside CloudWatch Metric Insights in Query Studio, per-GB ingestion pricing, and 15 months of retention. OTel metric types — gauge, sum, histogram, exponential histogram — are stored without lossy conversion, and high-cardinality label sets survive ingestion.
Together these make OTLP the lingua franca on every side of the estate boundary. That matters far more for hybrid than it does for AWS-only shops: an on-premises Java service, an Azure-hosted worker, and an EKS pod can now emit the same resource attributes to the same backend, and be correlated without a translation layer that silently drops dimensions.
Design consequence: Stop treating “on-prem telemetry” as a separate pipeline with a separate schema. Treat the datacenter as another collector deployment topology feeding the same contract. The differences reduce to network path, buffering, and credential vending — all solvable — instead of schema reconciliation, which is not.
4. Reference architecture
The architecture below is a four-tier pipeline. The tiering is the whole trick: it lets you enforce schema, cardinality, redaction, and cost policy in one place while sources remain heterogeneous.
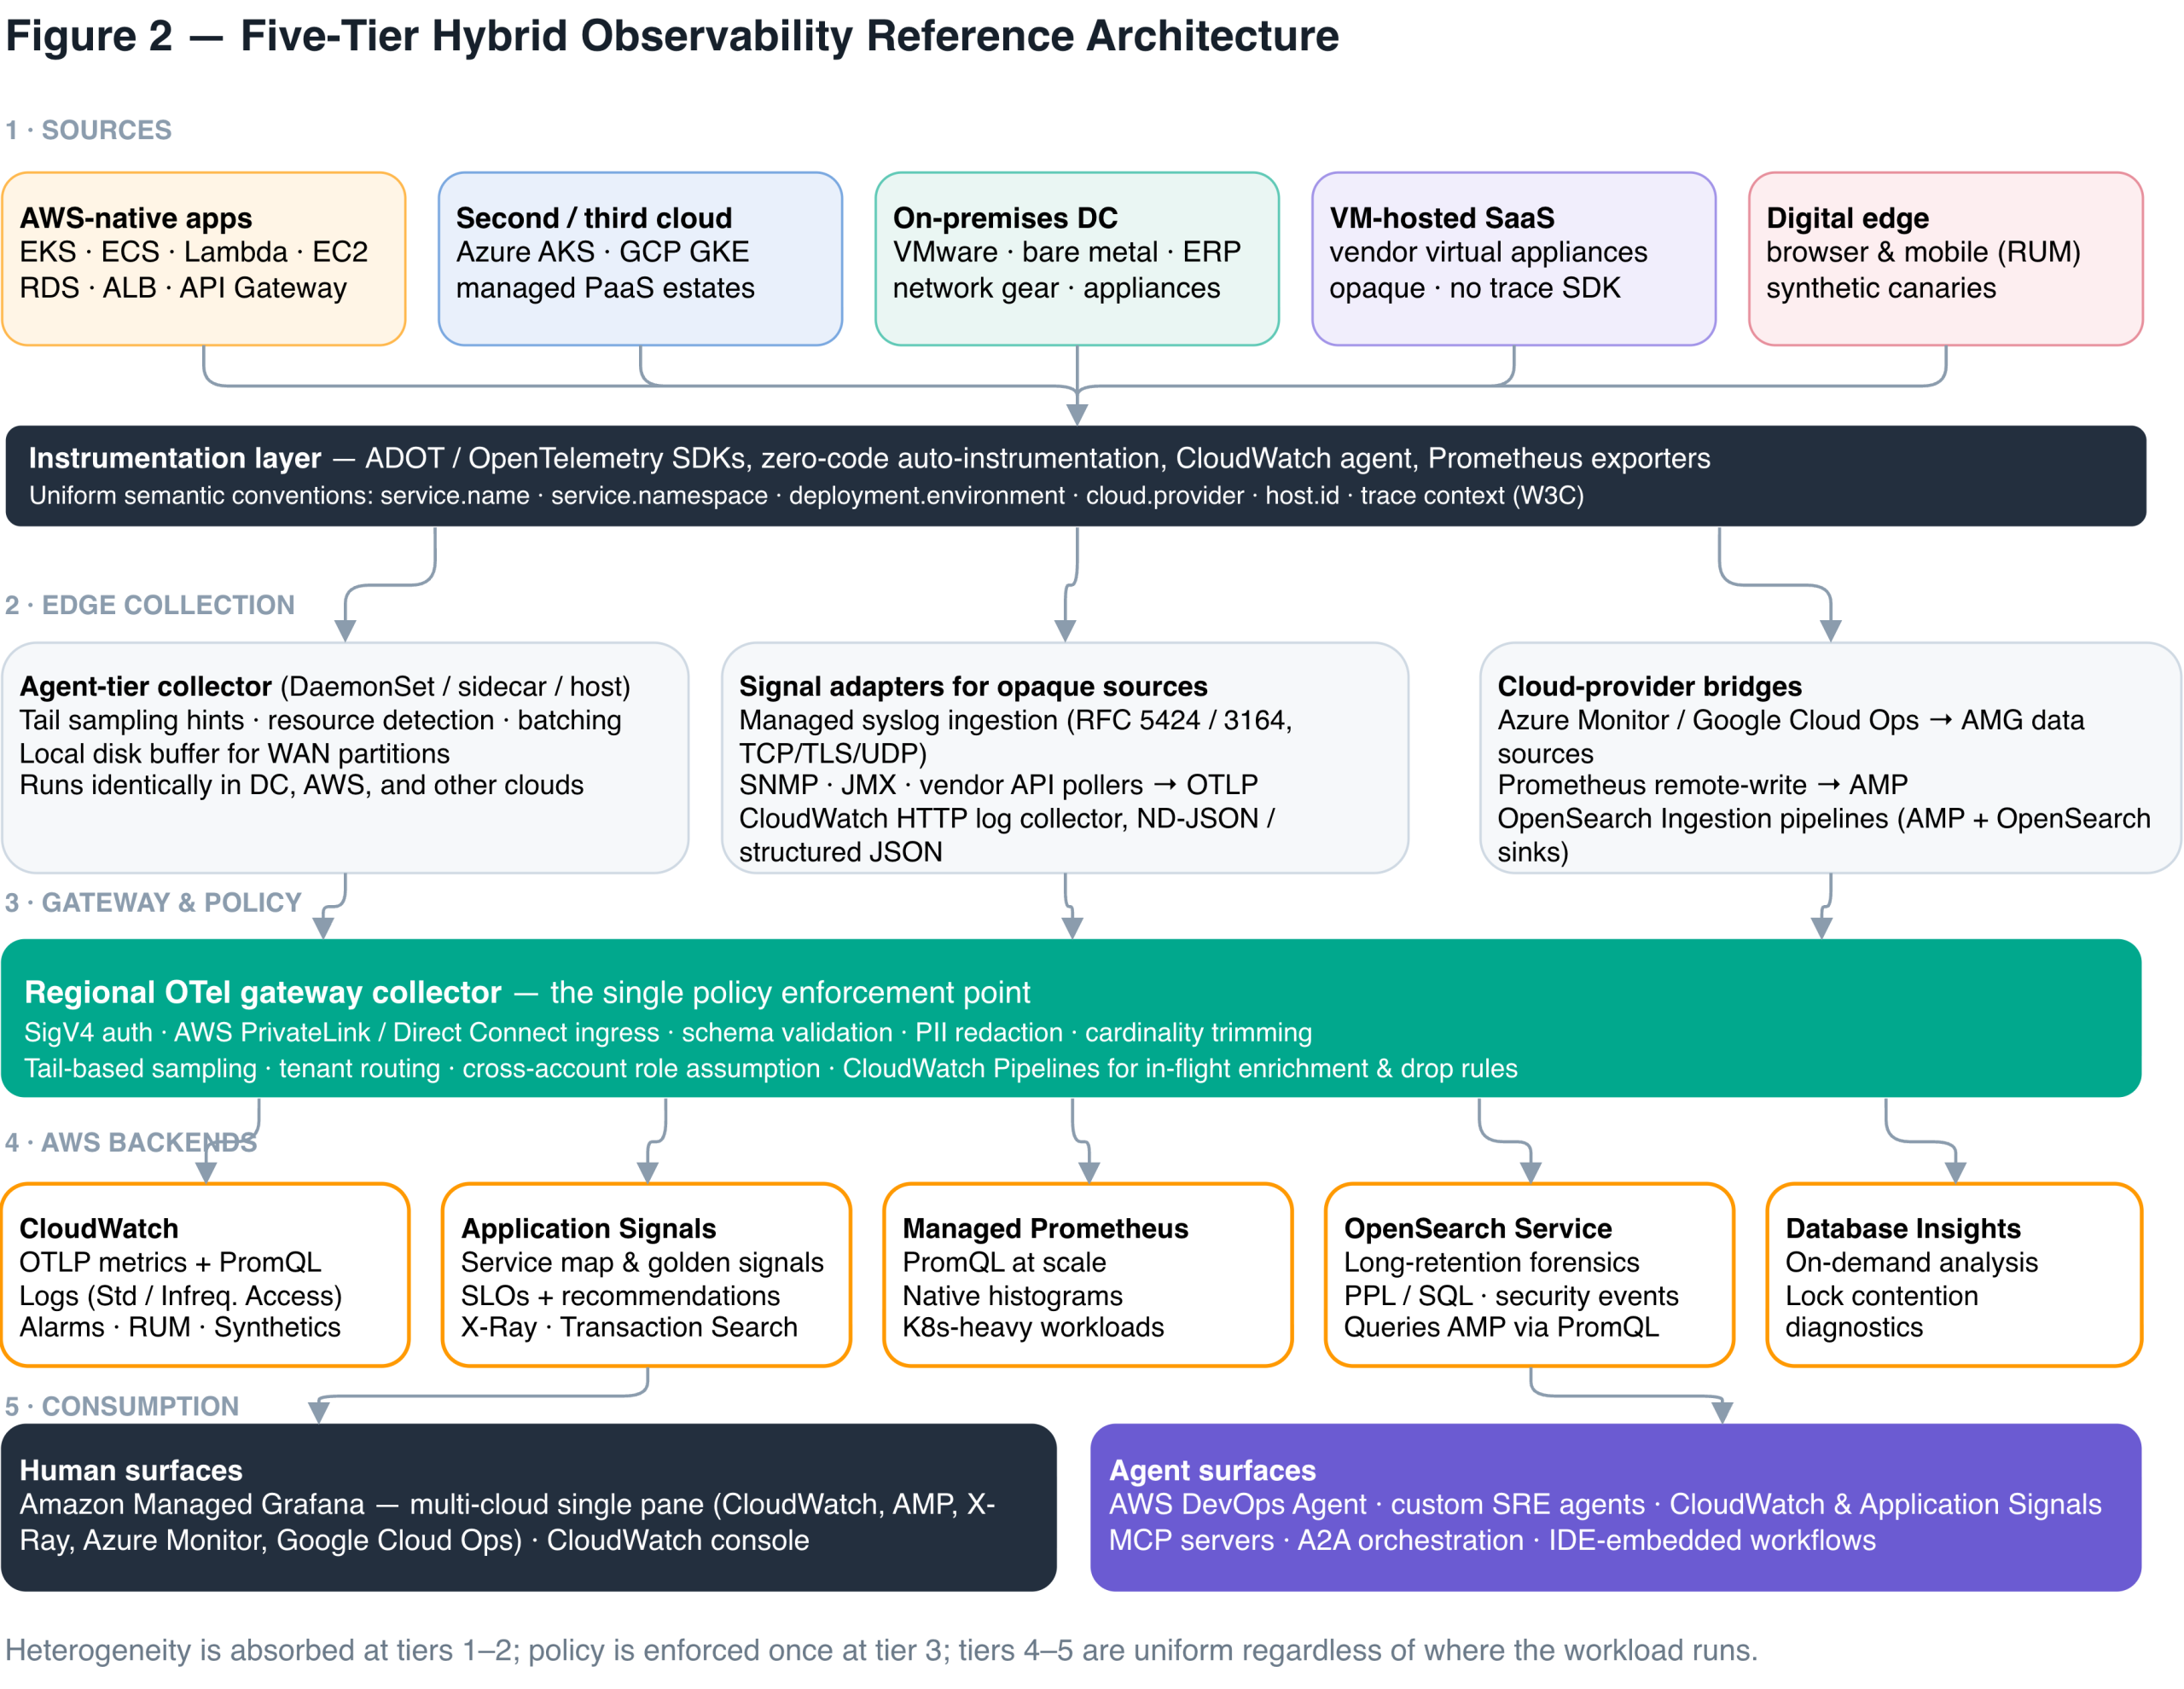
Why the gateway tier is non-negotiable
It is tempting to let every agent export straight to the CloudWatch OTLP endpoint. Resist it. A regional gateway collector — typically an ECS or EKS service behind an NLB, exposed to the rest of the estate over AWS PrivateLink or reached across Direct Connect — buys you five things you cannot retrofit later:
- Credential containment. On-premises and third-cloud hosts never hold AWS credentials; they authenticate to the gateway, which holds the SigV4 identity and signs to
monitoring.<region>.amazonaws.com/v1/metrics. - Tail-based sampling. Head sampling at the agent throws away the interesting traces. Only a gateway that sees whole traces can keep the 0.1% that erred.
- Cardinality and cost policy. One place to strip
pod.uid-class labels before they become a line item. CloudWatch Pipelines extends this server-side, including conditional processing and drop-event rules for both logs and OTel metrics. - Redaction before egress. Datacenter logs contain things that must not cross a boundary. Redact at the gateway, in-region, under your control.
- Routing. Metrics to CloudWatch or AMP, traces to X-Ray, verbose logs to the Infrequent Access class or OpenSearch — decided by attribute, not by re-instrumenting the fleet.
# Gateway collector — the policy tier, abridged
receivers:
  otlp: {protocols: {grpc: {endpoint: 0.0.0.0:4317}, http: {endpoint: 0.0.0.0:4318}}

processors:
  tail_sampling:                       # keep what matters, not a random 5%
    policies:
      - {name: errors,   type: status_code,  status_code: {status_codes: [ERROR]}}
      - {name: slow,     type: latency,      latency: {threshold_ms: 800}}
      - {name: baseline, type: probabilistic, probabilistic: {sampling_percentage: 2}}
  transform/redact:                     # never let regulated fields leave the boundary
    log_statements:
      - context: log
        statements: ['replace_pattern(body, "\b\d{12,19}\b", "[REDACTED-PAN]")']
  attributes/trim:                       # cardinality is a budget, spend it deliberately
    actions: [{key: k8s.pod.uid, action: delete}, {key: thread.id, action: delete}]
  resourcedetection: {detectors: [env, ec2, azure, gcp, system]}

exporters:
  otlphttp/cloudwatch:  {endpoint: https://monitoring.eu-west-1.amazonaws.com, auth: {authenticator: sigv4auth}}
  awsxray:               {region: eu-west-1}
  prometheusremotewrite: {endpoint: https://aps-workspaces.eu-west-1.amazonaws.com/.../api/v1/remote_write}
5. Signal-by-signal implementation
Metrics — collapse the two-backend problem
The historical hybrid pattern was CloudWatch for AWS-vended metrics and a Prometheus stack for everything else, with a federation layer bolted between them. With native OTLP metrics and PromQL in CloudWatch, plus Query Studio spanning PromQL and Metric Insights in one interface, that split is now a choice rather than a constraint. The pragmatic rule: CloudWatch as default sink for estate-wide metrics with 15-month retention; AMP where you have deep existing Prometheus assets — recording rules, alerting rules, Grafana dashboards — or genuinely extreme cardinality, where AMP’s native histogram support collapses 20+ bucket time series into a single series while preserving percentile accuracy.
Logs — tier aggressively, query in place
Log strategy is a cost strategy. Three moves compound:
- Route by value at the gateway. Debug-severity and high-volume access logs go to the CloudWatch Infrequent Access class, which now supports data protection and OpenSearch PPL/SQL querying — meaning the cheap tier is no longer the unqueryable tier.
- Stop exporting logs to query them. Logs Insights gained JOIN and sub-query commands, a
lookupcommand for query-time enrichment against a lookup table, tag-based log group querying, and 23 additional commands includingparse_json,parse_kv,percentile_cont, andcidr_match. Cross-log-group correlation of application and infrastructure errors now happens in place. - Ingest the un-instrumentable natively. Managed syslog ingestion over VPC endpoints (TCP/TLS/UDP, RFC 5424 and 3164, plus vendor formats like Cisco FTD/ASA) auto-parses into structured fields. This is the cleanest available answer for firewalls, load balancers, and VM-hosted SaaS appliances that will never carry an OTel SDK.
Traces — Application Signals as the front door
The mental model that holds in 2026: Application Signals is the primary observability surface; X-Ray is its trace store and query backend. Instrument with ADOT (zero-code auto-instrumentation where possible), export to the X-Ray OTLP endpoint, and you get service-level golden signals, a dependency map, SLOs with automatic recommendations based on historical performance, service-level SLO aggregation, and executive-ready SLO performance reports — plus Transaction Search for span-level retrieval when the aggregate view is not enough. Because OTel context propagates over any transport, this now spans on-premises and third-cloud hops that X-Ray SDKs could never reach.
Real user and synthetic — the outside-in check
Backend health is a proxy for customer experience, and a poor one during partial degradation. CloudWatch RUM with Session Replay lets an engineer watch the exact sequence a user experienced — a form that failed to render, a navigation flow that broke — instead of inferring it. Synthetics multilocation canaries run the same test from several Regions under one configuration and correlate results, so a single failing location reads as localised rather than global. In a hybrid estate this is also your cheapest detector for third-party and SaaS-integration degradation, where you own no telemetry at all.
6. Entity resolution: the unglamorous prerequisite
This is the section that determines whether everything above works, and it is almost always underinvested.
An observability platform is only as good as its ability to assert that the pod in EKS, the row in the CMDB, the deployment in the pipeline, the alert from the on-prem NMS, and the span in the trace all refer to the same logical service. Without that assertion, correlation is manual and agents hallucinate.
The practical mechanism is a small, ruthlessly enforced set of resource attributes applied at instrumentation time and validated at the gateway:
| Attribute | Contract |
|---|---|
service.name | The single canonical identifier. Must match the CMDB / service catalogue key exactly. No environment suffixes, no team prefixes, no drift. |
service.namespace | Business domain or bounded context. Drives ownership routing and SLO rollup. |
deployment.environment | Controlled vocabulary only: prod, stage, dev. Enables tag-based log group querying and environment-scoped alarms. |
cloud.provider, cloud.region, host.id | Placement facts, auto-detected via resourcedetection. Never hand-set — hand-set placement attributes are wrong within one quarter. |
service.version + deploy event | The change axis. Without it, “what changed?” is unanswerable and every L3/L4 capability degrades to correlation-without-causation. |
Enforce this in CI, not in a wiki. A collector that rejects — or quarantines and alerts on — spans missing a catalogue-resolvable service.name is worth more than another dashboard. For genuinely opaque sources (the VM-hosted SaaS appliance), synthesise the identity at the adapter: the syslog receiver or API poller stamps the correct service.name on ingestion, so the appliance appears in the entity graph as a first-class node even though it never emitted a trace.
Field note: The fastest measurable win in most hybrid programmes is not new instrumentation. It is a one-week reconciliation exercise that makes
service.nameagree with the service catalogue across every emitting surface. Service maps stop having orphan nodes, SLOs start rolling up correctly, and investigation quality improves immediately — with no new agents deployed.
7. The agentic layer
With L2 data and L3 SLOs in place, the agentic layer becomes tractable. The 2026 AWS-native shape of it:
- AWS DevOps Agent — previewed at re:Invent 2025, generally available since March 2026 — built on Amazon Bedrock AgentCore. It learns application relationships and integrates with observability tools, runbooks, code repositories, and CI/CD pipelines, correlating telemetry, code, and deployment data to triage autonomously. GA added the ability to investigate applications in Azure and on-premises environments, custom agent skills, custom charts and reports, and updated IAM managed policies. Built-in integrations span CloudWatch, Datadog, Dynatrace, New Relic, Splunk, Grafana, GitHub, GitLab, and Azure DevOps — which matters enormously for a hybrid estate carrying incumbent tooling it cannot rip out. AWS reports preview customers seeing up to 75% lower MTTR and 94% root-cause accuracy; treat vendor figures as directional and instrument your own baseline before and after.
- Custom SRE agents (June 2026) let you encode institutional knowledge — service architectures, known failure modes, preferred remediation — rather than relying on generic reasoning over your estate.
- MCP and A2A support turn the agent from an endpoint into a participant: it can call external tools, query knowledge bases, and orchestrate with other agents across organisational boundaries. The CloudWatch and Application Signals MCP servers expose alarms, metrics, logs, log patterns, SLO compliance, and distributed traces to any MCP-capable assistant.
- Webhook triggers allow PagerDuty, Datadog, ServiceNow, or a bespoke alerting pipeline to start an investigation automatically; disambiguation cards present structured choices to a human when the investigation hits genuine ambiguity, instead of stalling.
- Release management (preview) shifts the agent left — reviewing changes for production readiness, standards drift, dependency impact, and Well-Architected alignment before deployment.
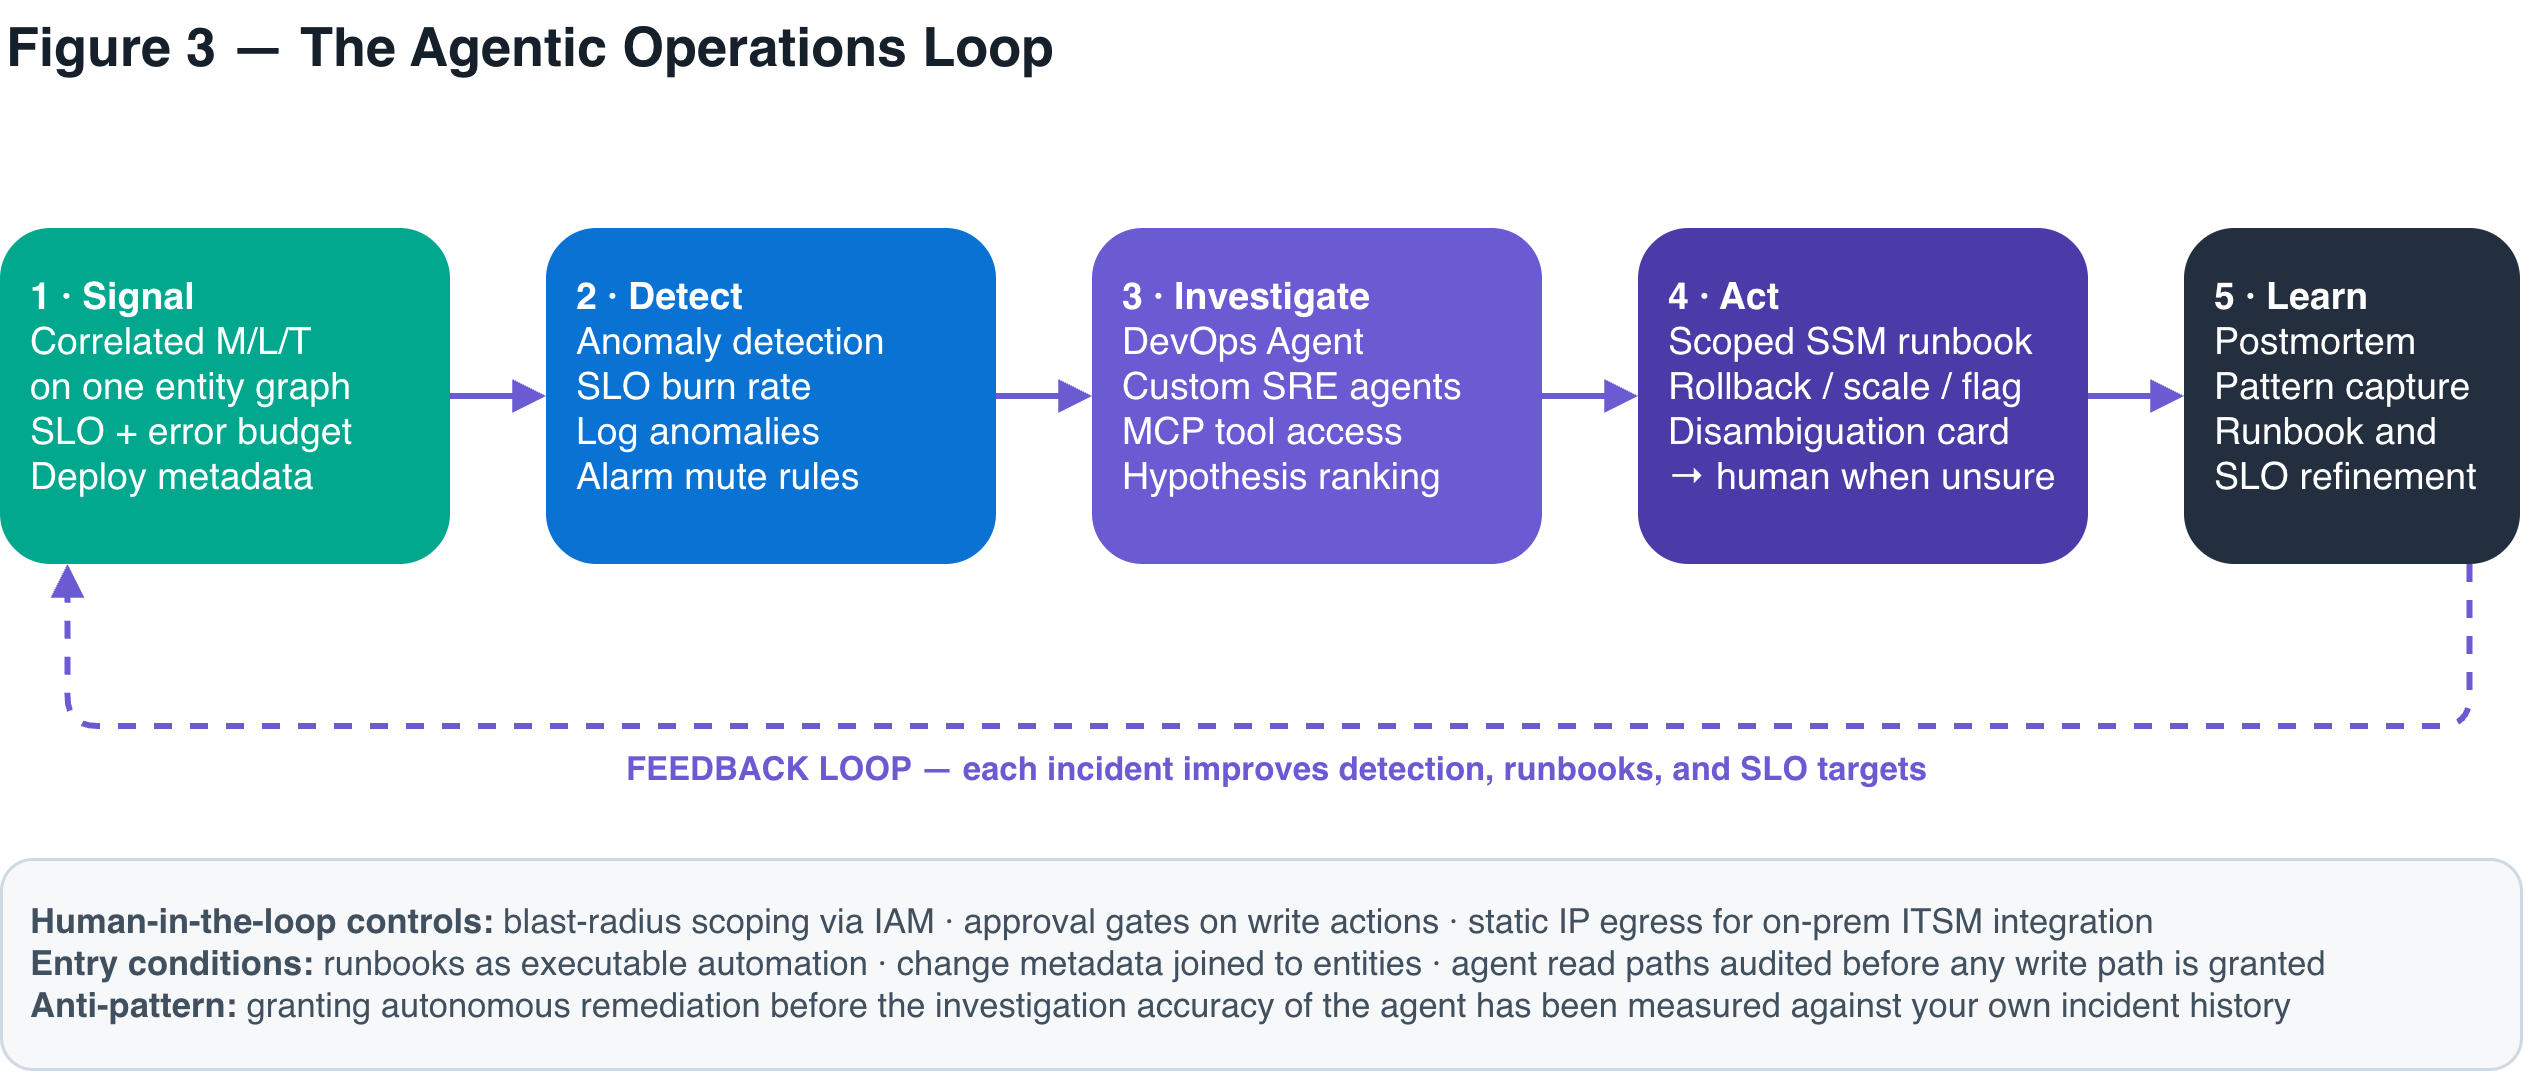
What must be true before you turn agents on
- Runbooks are executable, not prose. An agent cannot follow a Confluence page. SSM Automation documents, or equivalent, are the actuator.
- Read before write. Run the agent in investigate-only mode against real incidents for a full quarter. Score its hypotheses against your postmortems. Only then grant scoped write permissions, starting with the reversible ones — scale out, restart, feature-flag toggles — never schema or data-plane mutations.
- Blast radius is an IAM problem. Express what the agent may touch as policy, per environment, and audit it like any other privileged principal.
- Ambiguity escalates. Configure disambiguation so uncertainty routes to a human rather than resolving to a guess. Agents that always answer are worse than agents that sometimes ask.
8. Governance, cost, and sovereignty
Three constraints reliably decide the fate of hybrid observability programmes, and all three are architectural rather than operational.
Cost
Telemetry cost scales with cardinality and volume, both of which grow faster than the estate. Controls, in order of leverage: cardinality trimming at the gateway; log class tiering to Infrequent Access; CloudWatch Pipelines drop-event and conditional processing to discard low-value events before they land; native histograms in AMP to collapse per-bucket series; tail sampling to keep interesting traces rather than random ones. Budget telemetry as a per-service allocation with a named owner — an unowned cost line always grows.
Add the agent layer to that budget explicitly. DevOps Agent is priced on the cumulative time the agent spends on operational tasks, billed per second, with AWS Support customers receiving monthly credits scaled to their prior-month support spend. That is a genuinely different cost shape from per-GB telemetry: it rewards agents that terminate investigations decisively and penalises unbounded exploration. Cap and monitor it like any other consumption-based service.
Multi-account and multi-region shape
Use a dedicated monitoring account with cross-account metrics centralisation and source-typed log centralisation, so you choose per data source what flows centrally versus stays local. Cross-region telemetry enablement rules let you audit and enable telemetry across Regions from one place — the difference between a policy and a hope.
Sovereignty and residency
For regulated estates the gateway tier is what makes residency tractable: telemetry is redacted and filtered in-boundary before any cross-boundary export, and the routing decision is data-driven. Where a workload must remain within a sovereign perimeter, keep its backend there — CloudWatch RUM, for instance, is available in the AWS European Sovereign Cloud — and federate at the visualisation layer in Amazon Managed Grafana rather than by copying data.
Multi-cloud, honestly: “Single pane of glass” is achievable at the visualisation layer today: Amazon Managed Grafana connects to CloudWatch, AMP, X-Ray, OpenSearch, Azure Monitor, and Google Cloud Operations concurrently, letting you build cross-estate dashboards while minimising data export from each provider’s native store. It is not yet fully achievable at the correlation layer — cross-provider causal analysis still needs the telemetry co-located, which is exactly what the OTLP contract and gateway tier deliver for the workloads you choose to centralise. Be deliberate about which estates you federate for viewing versus centralise for analysis.
9. A phased adoption roadmap
Phase 1 — Foundation (~1 quarter · exit gate: one identity, one contract). Publish the resource-attribute contract and reconcile service.name against the service catalogue across every emitting surface. Stand up the regional OTel gateway with PrivateLink ingress. Onboard three pilot services spanning at least two estate boundaries (one AWS, one on-prem or other cloud). Migrate any X-Ray SDK instrumentation to ADOT — the February 2027 end-of-support date makes this urgent, not optional. Exit criteria: a trace that crosses a boundary renders as one trace; every pilot entity resolves to exactly one catalogue key.
Phase 2 — Coverage and correlation (~2 quarters · exit gate: unknown-unknowns are answerable). Roll instrumentation across tier-1 services. Bring opaque sources in via managed syslog, HTTP log collector, and API-poller adapters. Enable Application Signals and Transaction Search. Route logs by value across Standard and Infrequent Access. Stand up Amazon Managed Grafana with Azure Monitor and Google Cloud Operations data sources for the estates you are federating rather than centralising. Exit criteria: an engineer can answer a question nobody anticipated — “which tenants on which cluster saw p99 > 2s after yesterday’s release?” — in a single query session, without exporting data.
Phase 3 — SLOs and intelligent detection (~2 quarters · exit gate: alerts are actionable). Define SLOs on customer-facing journeys, using Application Signals SLO recommendations as a starting point and service-level aggregation for rollup. Replace static threshold alarms with SLO burn-rate alerts and anomaly detection. Adopt alarm mute rules for planned change windows. Join deployment and change metadata to the entity graph — this is the step most often skipped and most often regretted. Exit criteria: alert volume down materially, actionable-alert ratio up, and every page maps to a burning error budget rather than a breached host threshold.
Phase 4 — Agentic operations (ongoing · exit gate: measured autonomy). Convert top runbooks to SSM Automation. Enable DevOps Agent in investigate-only mode; wire webhook triggers from your existing alerting stack. Score investigation quality against your own postmortem record for a quarter. Build custom SRE agents encoding your failure modes. Then, and only then, grant narrowly scoped remediation permissions on reversible actions. Exit criteria: a published, measured accuracy figure for agent-proposed root causes on your incidents — not a vendor’s.
10. Anti-patterns worth naming
| Anti-pattern | Why it fails, and the correction |
|---|---|
| Instrument everything at once | Produces enormous volume and no correlation, because the identity contract was never settled. Correct: fix identity on three services first; coverage without correlation is expenditure without capability. |
| Treating on-prem as a separate pipeline | Guarantees a permanent schema-reconciliation tax and a permanent blind spot at the boundary. Correct: same OTLP contract, different collector topology. |
| Head sampling at the agent | Discards the rare error traces you needed and keeps the common healthy ones you didn’t. Correct: tail sampling at the gateway, biased to errors and latency outliers. |
| Dashboards as the deliverable | Dashboards answer questions you already had. Correct: measure the practice by time-to-answer for novel questions, not by dashboard count. |
| Agents on L0 data | Confident, well-formatted, wrong. Correct: the gates in Figure 1 are prerequisites, and the cheapest way to discover this is to score the agent before granting it write access. |
| Unowned telemetry spend | Grows until finance forces an indiscriminate cut that removes exactly the high-cardinality data L2 depends on. Correct: per-service telemetry budgets with named owners, enforced at the gateway. |
Measuring the practice itself
Instrument the observability programme with the same rigour you demand of the applications. The four metrics that track maturity honestly:
- Mean time to first useful hypothesis (not MTTR — MTTR is contaminated by fix complexity).
- Entity resolution rate — the percentage of emitting surfaces whose
service.nameresolves to exactly one catalogue key. - Actionable alert ratio — pages that resulted in a change divided by total pages.
- Telemetry cost per transaction — normalises spend against business volume, so growth and waste are distinguishable.
Closing: The 2026 AWS observability stack has removed most of the technical excuses. OTLP is a genuine estate-wide contract; CloudWatch stores high-cardinality OTel metrics natively and answers PromQL; Application Signals gives services SLOs and a map that reaches beyond AWS; agents can investigate across multicloud and on-premises boundaries. What remains hard is unchanged and unglamorous: agreeing what a service is, everywhere, and keeping that agreement true as the estate changes. Get that right and every layer above it — from a threshold alarm to an autonomous SRE agent — becomes tractable. Get it wrong and you will have bought the most sophisticated wrong answers in the industry.
Sources and further reading:
- AWS Observability ICYMI: Jan–May 2026 · This Month in AWS Observability: June 2026
- X-Ray SDKs/Daemon End-of-Support and OpenTelemetry Migration
- OpenTelemetry and PromQL support in CloudWatch
- CloudWatch OTLP Endpoints
- Deploy OpenTelemetry Gateway on AWS
- CloudWatch and Application Signals MCP servers
- Announcing GA of AWS DevOps Agent
- CloudWatch managed syslog ingestion
- Native histogram support in AMP
- Amazon Managed Grafana + Azure Monitor
- Migrating from X-Ray to OpenTelemetry