
Executive Summary:
Day 2 operations” mark the ongoing management and optimization of cloud applications after deployment. For business leaders, success in this phase depends on more than uptime—it requires real-time visibility into how applications impact revenue, customer experience, and overall business outcomes.
This blog demonstrates how enterprises can build a Day 2 observability framework using AWS native services. The approach integrates monitoring, tracing, and analytics into executive-ready dashboards powered by Amazon QuickSight, bridging the gap between technical metrics and business insights.
Business Challenge
Modern applications generate massive amounts of telemetry—logs, traces, events, and metrics. However, business leaders often lack the tools to translate this data into outcomes they care about:
Revenue impact visibility – Are performance issues affecting transactions or revenue?
Proactive alerting – Can we detect and resolve issues before customers notice?
Historical trend analysis – How do we plan capacity and optimize ROI?
Cost-performance linkage – Are we optimizing infrastructure spend relative to business outcomes?
Without a structured observability strategy, enterprises risk flying blind, reacting late to incidents, and overspending on underutilized infrastructure.
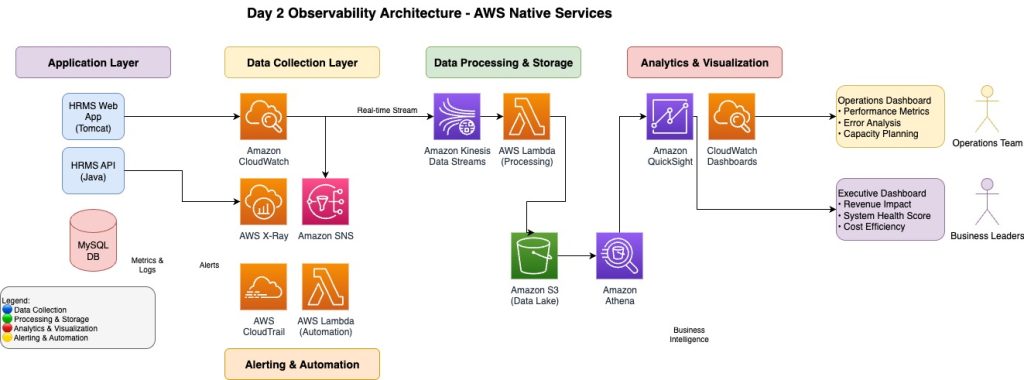
Solution Architecture Overview
Our Day 2 observability solution leverages AWS native services to transform technical telemetry into business intelligence.
Core Components
Data Collection
Amazon CloudWatch – Metrics and logs
AWS X-Ray – Distributed tracing
Amazon CloudTrail – API auditing
Data Processing & Storage
Amazon Kinesis – Real-time stream ingestion
Amazon S3 – Centralized data lake
Amazon Athena – Ad-hoc query engine
Analytics & Visualization
Amazon QuickSight – Business dashboards
CloudWatch Dashboards – Technical KPIs
Alerting & Automation
Amazon SNS – Notifications
AWS Lambda – Automated remediation
Implementation Strategy
Phase 1: Foundation Setup (Weeks 1–2)
Enable CloudWatch enhanced monitoring for custom business KPIs.
Configure AWS X-Ray service maps for distributed tracing.
Phase 2: Data Pipeline (Weeks 3–4)
Stream application and business events through Amazon Kinesis.
Enrich metrics with AWS Lambda functions and store them in Amazon S3.
Phase 3: Dashboard Development (Weeks 5–6)
Build Amazon QuickSight dashboards aligned with executive KPIs.
Enable self-service reporting for finance, product, and operations leaders.
Phase 4: Optimization (Weeks 7–8)
Integrate alerts, automation, and governance controls to enhance operational efficiency.
Establish cost optimization guardrails for logs, metrics, and storage.
Business Dashboard Examples
Executive Summary Dashboard
Revenue impact in real time
Composite system health score
Cost efficiency vs. business value
Operational Excellence Dashboard
Latency trends & error analysis
Capacity utilization and scaling patterns
Security posture metrics
Financial Impact Dashboard
Cost attribution by BU, app, or transaction
ROI analysis (infrastructure cost vs. productivity gains)
Forecasting with predictive analytics
Business Outcomes
By adopting AWS native observability services, enterprises can expect measurable improvements:
60% faster MTTR through real-time telemetry correlation
80% proactive issue detection before end-user impact
25% cost savings via optimization of unused/idle resources
90% executive adoption of dashboards for decision making
Security & Compliance
Encryption at rest & in transit with AWS KMS
Role-based access control in QuickSight for data governance
Audit readiness with CloudTrail for compliance requirements
Strategic Roadmap
Next 30 Days: Align KPIs with leadership, pilot critical workflows, and train teams.
3–6 Months: Integrate ML-driven anomaly detection with Amazon SageMaker.
6–12 Months: Scale to AI-driven insights, predictive scaling, and enterprise-wide observability.
Conclusion
Day 2 observability is no longer optional—it’s a business imperative. By leveraging CloudWatch, X-Ray, Kinesis, and QuickSight, enterprises can bridge the gap between technical performance and business outcomes.
The result: real-time executive visibility, faster issue resolution, optimized costs, and data-driven business agility.
At Cloudlytics, we help enterprises go beyond monitoring to build observability frameworks that tie cloud operations directly to business value.