How to Monitor Kubernetes Audit Logs?

As the popularity of Kubernetes platform for deploying container-based applications keeps soaring every passing day, the challenge of keeping it secure and away from prying eyes has increased manifold. With every container you add, the area prone to attack widens, and so does the number of entry points for malicious activities.

So, if you are scaling without keeping in check the security, you are exposing critical data to unauthorized users and thereby putting your organization at a severe security risk. This is why businesses have started employing Kubernetes audit logs for Kubernetes logging and monitoring. It allows you to mitigate the risk of unwanted access and misconfigurations, along with protecting your organization against abuse of its Kubernetes resources.

This blog discusses everything you need to know about Kubernetes audit logs, including best practices to follow to excel at it.

What are Kubernetes Audit Logs?

Kubernetes audit logging was first introduced in Kubernetes 1.11. It ensures your Kubernetes remain secure and away from unauthorized access.

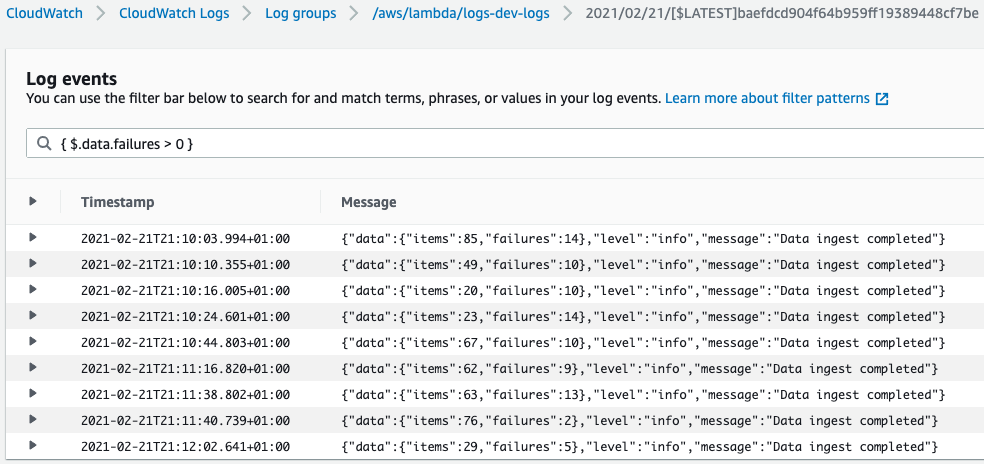
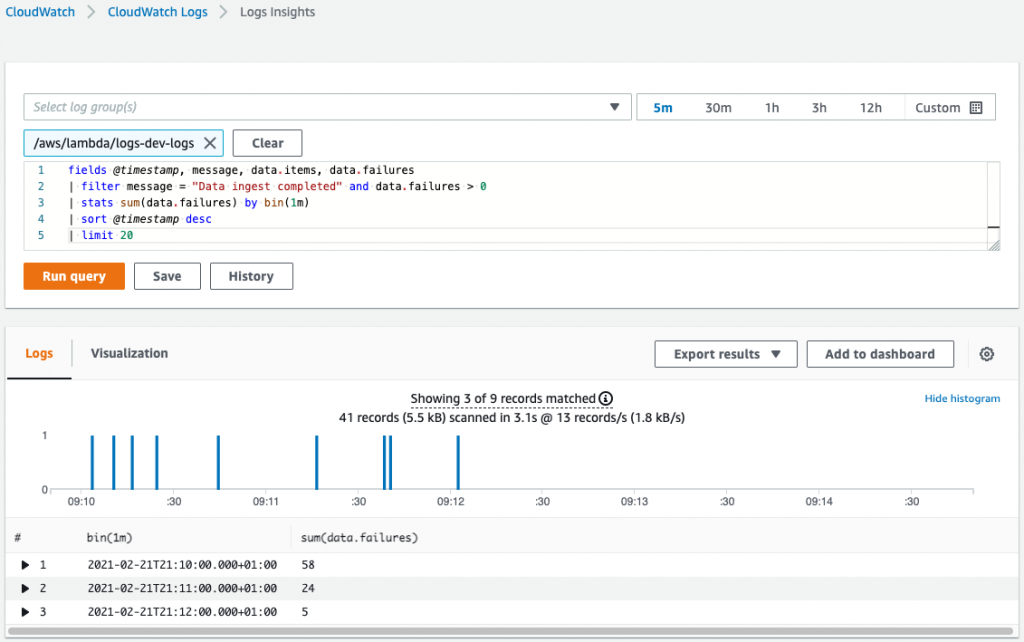
Kubernetes API is the centre of everything that happens within Kubernetes. Audit logs are structured in JSON, with each log containing rich metadata. For example, it includes the requested URL path, the HTTP method, and the user information sending the request.

Kubernetes API server processes all the changes to Kubernetes state and stores the same as backend storage. It makes these servers ideal for Kubernetes audit logs to send record requests to. This allows capture of every modification taking place within a cluster. This is because API server processes requests from a wide array of internal and external elements, such as –

  • Itself
  • The control plane
  • Nude daemons (example – the kube-proxy and the kubelet)
  • Users making kubectl requests
  • Cluster services, such as CoreDNS and kube-state-metrics
  • Items sending requests through a kube client, such as applications, controllers, and operators

Why Should You Monitor Kubernetes Audit Logs?

Attackers use a myriad of ways to get access and modify Kubernetes clusters, including resources, services, and accounts. At the same time, most of the techniques rely on benefitting from basic misconfiguration pertaining to your RBAC policies or the Kubernetes environment. So it is imperative to have a Kubernetes audit log analysis to track how a cluster is behaving.

Kubernetes audit logs are turned off by default. The default settings allow users to store Kubernetes events in the backend database for up to one hour. But it can be insufficient when you are looking to track unauthorized access.

Enabling audit logs would allow you to capture events and modify actions (create, update, read, or delete). 

It also lets you track the heartbeats sent from a node to the API server. The kube-apiserver is responsible for auditing a Kubernetes cluster. So whenever a request creates a namespace, it is sent over to it for logging and auditing.

It means that by integrating Kubernetes audit logs, you can figure out the answers to the following –

  • What happened?
  • Who did it?
  • When did it happen?
  • What was the location of such an occurrence?

Therefore, whenever a malicious activity happens within a cluster, the actions are automatically registered in the audit log. It then brings your security tools into play. They parse the events available in the audit log and inform the requisite parties about such unwanted access and modification.

It is imperative to understand that a Kubernetes cluster is a happening place, i.e., there is a lot of activity going on, but you need not record every single instance of every such occurrence. Having a well-rounded audit policy lets you filter critical events from the rest and record them separately.

How to Monitor Kubernetes Audit Logs?

Depending on your Kubernetes audit policy, the API captures specific information in your audit logs. 

It is divided into stages or events –

  • RequestReceived – It is generated as soon as the audit handler receives a request. There is no processing involved here.
  • ResponseStarted – These are generated after the response headers are sent but before sending the response body.
  • ResponseComplete – It is generated after sending the response body.
  • Panic – It is generated when panic takes place.

Not every stage applies to all the requests. In addition, you can also define the audit level to inform the system of the level of event that has to be recorded.

We can distinguish audit levels into four primary categories –

  1. None – The system doesn’t log events containing this string.
  2. Metadata – It logs request metadata, such as resource and timestamp, but skips recording the request or response bodies.
  3. Request – It doesn’t apply for non-resource requests and logs event metadata and request body only. It skips the response body.
  4. RequestResponse – It logs the entire event, including its metadata, request, and response bodies. But this command is inapplicable for non-resource requests.

Given the intricacies involved, it is critical to deduce a policy that filters requests specific to user needs, such as pods, secrets, and kube-proxy.

Here is a sample audit policy –

apiVersion: audit.k8s.io/v1 # This is required.
kind: Policy
# Don't generate audit events for all requests in the RequestReceived stage.
omitStages:
 
- "RequestReceived"
rules:
 
# Log pod changes at RequestResponse level
 
- level: RequestResponse
   
resources:
   
- group:" "
     
# Resource "pods" doesn't match requests to any subresource of pods,
     
# which is consistent with the RBAC policy.
     
resources: ["pods"]
 
# Only check access to resource "pods"
 
- level: Metadata
   
resources:
   
- group:" "
     
resources: ["pods/log", "pods/status"]
 
# Don't log watch requests by the "system:kube-proxy" on endpoints or services
 
- level: None
   
users: ["system:kube-proxy"]
   
verbs: ["watch"]
   
resources:
 
  - group:" "# core API group
     
resources: ["endpoints", "services"]
 
# Don't log authenticated requests to certain non-resource URL paths.
 
- level: None
   
userGroups: ["system:authenticated"]
   
nonResourceURLs:
   
- "/api*" # Wildcard matching.
   
- "/version"
 
# Log the request body of configmap changes in kube-system.
 
- level: Request
   
resources:
   
- group:" "# core API group
     
resources: ["configmaps"]
   
# This rule only applies to resources in the "kube-system" namespace.
   
# The empty string "" can be used to select non-namespaced resources.
   
namespaces: ["kube-system"]
 
# Log configmap and secret changes in all other namespaces at the Metadata level.
 
- level: Metadata
   
resources:
   
- group:" "# core API group
     
resources: ["secrets", "configmaps"]
 
# A catch-all rule to log all other requests at the Metadata level.
 
- level: Metadata
   
# Long-running requests like watches that fall under this rule will not
   
# generate an audit event in RequestReceived.
   
omitStages:
     
- "RequestReceived"

Kubernetes allows you to place multiple audit rules in a Kubernetes audit policy, but when the system processes an event and compares it to them, it is only the first matching rule that sets the event’s audit levels. It is a far cry from RBAC and Kubernetes policy, where the most restrictive rule is the one that leads the charts.

How Do You Enable Audit Logging in Kubernetes?

While there are multiple audit rules, there are specific fields for defining each one of them –

  • level – It defines the range or the verbosity of the event.
  • resources – The object to be audited.
  • nonResourcesURL – It defines a virtual location not associated with any other resources.
  • namespace – It defines objects within a namespace subject to audit.
  • verb – It defines a specific operation for the current audit, such as create or delete.
  • users – It is the authenticated user for the current rule.
  • userGroups – It is the authenticated user group for the current rule.
  • omitStages – It allocates stages where the system can skip generating events at. 

Since the Kubernetes audit logs are turned off by default, you will have to execute a function to activate it. One way of doing it is passing the audit-policy-file flag during the process of initiation of kube-apiserver in addition to the audit policy defined by you.

The last step is to specify the path to the file using the audit-log-path function. It would provide a location to the API. If you do not do it, it will output logs to Stdout by default in JSON format.

Challenges involved

While establishing Kubernetes audit logs seems an easy task to master, it is far from it. Even though the principles of audit logs collection and analysis apply to the cloud, and more specifically, to the data centres based on Kubernetes automatically, the dynamic nature of the environment makes audit logs an expensive, cumbersome, and tedious task.

Given that a cluster houses thousands of daily log entries, it is only sane not solely to depend on manual inspection to chalk out irregularities. Even the quietest clusters with no human intervention regarding actions and no shift in applicative activity process many API calls every hour. These are generated by the internal Kubernetes mechanisms that work to ensure that the cluster is alive and functioning and its resources are utilized according to the established deployments. In addition, it helps identify and recover from anomalies and failures automatically.

So, even using a log filtering tool doesn’t mean you have your task cut out. You will require proactiveness, experience, and intuition to figure out minute yet sensitive entries that often pass unabated.

The dynamic nature of Kubernetes also adds to its audit log challenges. You will find multiple workloads added, removed, and modified every second. It means you will require a keen eye and an in-depth understanding of sensitive databases to figure out anomalies. Also, there can be instances when an activity has previously not been recorded by the system. In such cases, it would be dicey to depend on alerts altogether. Instead, you will have to employ additional tools to understand the context and move accordingly.

Kubernetes Audit Logs Best Practices

By now, it is clear that Kubernetes comes with its set of challenges, and those can be hard to tackle unless you have a set pattern. Thankfully, we have you covered. Here are the Kubernetes audit logs best practices which should act as a reference for you –

1) Establish a Logging system

While it is not difficult to activate and reach Kubernetes audit logs, the real challenge is to choose a location to make them easily accessible, even in an emergency. It is imperative to have a dedicated and centralized access point to ensure these remain separated from the rest of your data.

2) Try Avoiding Sidecars for the Logging System

One of the best Kubernetes audit logs practices you can follow is to have a single container instance per pod. It allows you to have the same image for multiple instances of the same container stored in the same pod. In addition, it enables you to have the same container replicated within the pod based on the same instance.

Having a sidecar means creating an additional container for capturing the output of the first container that houses your actual app. It not only takes up extra space but also slows down your system’s processing speed as it has more data to now fiddle with. But it can also be unavoidable in circumstances where you do not have control of the app or have the container away from the logging framework.

In such cases, you can establish a system to collect all logs from the entire node having a single container or not collecting anything otherwise.

3) Writing Logs to Stdout and Stderr

While it is a norm to shift to a containerized environment, we have come across a host of companies focusing on apps that log to files. Allowing logs to redirect to Stdout and Stderr enables you to have a centralized logging framework that can then stream the logs to your desired location more constructively. It also lets you have more control over the data being distributed and place additional filters for better bifurcation.

4) Setting Resource Limits on Log Collection Daemons

Kubernetes logs are difficult to manage at the cluster level, given the large volume. But DaemonSets enables you to run containers in the background and deploy similar containers with pods meeting specific criteria. You can use different software to collect logs in Kubernetes and run them with your workloads using DaemonSets. But for optimizing your log file collection endeavor, you need to set a resource limit per daemon.

5) Having a Robust Retention Mechanism

Audit logs eat a lot of space, and your system’s memory is in red before you even realize it. So it is necessary to have a clear retention policy devoid of any ambiguity that pans out the road ahead for storing and referencing audit logs. Therefore, if you are going for a higher retention policy, you will have to chalk out the probable cost associated with it. Several vendors offer managed logging services that help curtail your infrastructure budget, but security is often a factor deterring people from choosing them.

6) Use SIEM Tools for Improved Alerts

By default, Kubernetes allows users to generate audit logs on API-based invocations. But you must tackle unwanted behavior by enabling the Kubernetes logging and monitoring facility to ensure optimum security. In addition, you can also track illegal changes in your clusters by leveraging operational Kubernetes monitoring logs.

These additional layers inform you of anomalous behavior and help track vulnerabilities leading to potential cyberattacks. It is where SIEM tools come into play. These let you raise alerts automatically and set up a robust and customized dashboard for optimum visualization and generating improved and actionable Kubernetes security data.

7) Distinguishing Between Production and Development Clusters

When you do not have distinguished clusters for development and production purposes, you often end up deleting crucial data too soon or preserving stale information for longer than required. This is why you should have different production and development clusters. It would also mean having different storage locations for both. Kubernetes allows its users to switch seamlessly between the two by using the kubectl config use-context command.

How Cloudlytics Helps Monitor Kubernetes Audit Logs?

By now, you may have already understood that Kubernetes audit logs are a complex exercise. It allows you deeper visibility into cluster operations, helps you develop a robust container infrastructure and enables you to track anomalies. But given the dynamic nature of the Kubernetes environment, it is imperative to keep a tab of additional features and improvements.

At Cloudlytics, we provide clients real-time visibility into their cloud applications and infrastructure. We provide a SaaS solution helping you garner insights for your cloud security. In addition, we simplify the complexities involved in the Kubernetes audit logs and help optimize the compliance of your business operations with set standards.

Click here to explore our services. 

What is Structured Logging?

Developers typically do not like to make logs as they complete the development process. They do so to avoid delays. Logs come into play when there is an issue with the development. If proper logs are maintained, it helps detect issues and take corrective actions to resume the production process. 

Structured logging is a way of creating logs that can be used to implement better-formatted logs. As a result, anyone accessing these logs can better understand the data, structure and fast-track the development process. 

Developing a digital solution with any programming language requires writing huge code scripts that need to be compiled and rendered to produce the intended result. As soon as the solution reaches the production stage, developers are notified about the issues with the solution. 

One issue in the application can arise for several reasons, and finding the main reason without logs isn’t easy. Let’s discuss structured logging and how to use it for effective error resolution. 

What is Structured Logging?

Every log entry includes the description of the event, its date, time, and the device’s properties on which the event originated. In addition, it contains the user’s identity using the solution and the severity level of the issue. 

Standard log entries are based on a textual format. As this format is easily readable by a human, it is difficult for a machine. This is even more difficult for a machine to automate the log investigation and use a customized algorithm to index and search the log files. 

As structured logging represents a consistent and predetermined format for creating logs, it helps convert the textual format of logs into data. After creating a relational data set with structured logging, the log files can be easily searched, indexed, and interpreted by a machine as well as a human. 

Besides the elements included in a standard log event, a structured log adds a unique event ID, the protocol used to run the application, and the port used by the user to execute the function under scrutiny. 

Why Use Structured Logging?

Simply put, without structured logging, we cannot use a machine or any other analytical tool to process and view log data. It won’t be possible to customize the log reading and inferring sequences. 

As a result, we are limited to using options that can be read and non-standard log structures. You can try to build a customized log data reading here, but the chances of it working are negligible. 

Automation is the key benefit of using structured logging and creating an easy way to identify the errors of the application, software, etc. 

Developers can create customized log reading solutions with the help of third-party open-source libraries. This removes the need to write a customized algorithm, as these libraries might have a ready-to-use structure. As a result, you can save time and effort that will be otherwise put into creating a log reading system from scratch. 

Structured Logging Vs. Basic Logging Vs. Semantic Logging

A structured log is easy to read and understand. Instead, you read a basic log without any issue, but the lack of information makes reading a basic log troublesome. As we have seen above, a structured log holds more information than a basic log. This means you can solve the issue faster with structured logging compared to basic logging. 

Semantic logging is another type of logging structure using strongly-typed events meant to create a consistent log. Semantic logging can be read and understood with Windows-based tools like Event Tracing for Windows (ETW). There isn’t a structural difference between semantic and structured logging. 

The motive of using semantic logging is to create a well-defined log, in other words, a structured log. The only difference is that  Microsoft promotes semantic logging and its associated solutions get a better chance at making their platforms usable by the development community. 

Besides this, how the logs are created is also different. Here’s an example:

Semantic Log

[EventSource(Name="Company-EventLog")]
public sealed class MyEventSource : EventSource
{
  public static MyEventSource Log = new MyEventSource();

  [Event(1, Message="Request submitted: {0}", Channel = EventChannel.Operational)]
  public void RequestSubmitted(string requestId)
  {
    this.WriteEvent(1, requestId);
  }
}

Structured Log

Source: Humio

Are Log Files Structured Or Unstructured Data?

We see three types of data while creating log events;

  • Structured
  • Semi-Structured
  • Unstructured

The final position of the log created depends on the method used for logging the events. If you are using a structured logging method, you will have structured data. On the contrary, using basic logging to create an event will deliver unstructured data. 

Out of the two, structured data is easier to understand, infer, and it has high chances of resolving the issues quickly. 

How Do You Implement Structured Logging With a Data Parsing Tool?

Structured logging requires tools that can help record the events and arrange them into a readable format. This is required because even if the production team uses a customized script to read the event logs, the machine can do it easily. 

Parsing a log file means splitting the log data into groups of information that can be easily stored and edited if required. As every log file or data set includes tons of information stored as text. 

We parse the log data to segregate this collected data and create groups to understand the same in a meaningful manner. An example of parsing would be collecting all the customer IDs in the log file into one group. 

Here’s the process of parsing structured log data;

  • As soon as the application or any digital solution creates a log entry, the information in the log is captured and stored. This is completed with a log aggregation tool. 
  • After recognizing the log entry source, the required parsing algorithm is executed, which helps transform the data into a structured logging schema. 
  • Similarly, the parsing tool also combines the log entry data with other types of data applicable to complete the process. 

As a result, the development team can create a customized system to analyze and interpret the log data to find the errors. 

Using data parsing is more critical when the application creates an unstructured data log. However, even when an application creates structured logs, parsing is required to standardize the log data for practical analysis and search. 

How Can Cloudlytics Help You With Structured Logging?

Cloudlytics helps streamline real-time visibility for an organization’s cloud-based systems and solutions. 

Cloudlytics helps provide companies with effective visibility into these systems to create a more secure and transparent working environment. When it comes to structured logging, Cloudlytics helps create a support structure required to implement the structured logging. 

As a result, your organization can harness a log structure to create the most potent event logs. 

Conclusion

A better log data structure ensures higher visibility into the event issue and ensures better success with the resolution. Structured logging is at the forefront of developing a digital solution and ensuring that every issue arising during production is addressed and corrected quickly.

AWS Lambda Logging Best Practices

What is AWS Lambda Logging?

AWS Lambda functions are a special kind of service that allows you to run your code without provisioning them onto servers. Lambda is dynamic in its scalability and can run between a few requests per second to a few thousand per second. Unlike traditional hosting, Lambda functions allow you to pay for the code when it’s running and not when it’s sitting idle. This accounts for a significant decrease in spending and optimizes efficiency as well.

AWS Lambda functions are used when you need to run a function for a short time. Usually, a common application is when you want to pass a function as an argument to a higher-order function.

AWS Lambda logging is a form of automatic monitor of all the lambda functions. AWS Lambda comes with a CloudWatch log that allows you to group your function activity as well as each instance of your function

What does Lambda Logging Include?

Logging your functions in AWS Lambda is pretty straightforward. You write a print message, and it gets added to your Cloudwatch. What follows suit is a surprisingly long bill for simple logging just for the usage of CloudWatch. This may even involve simple debugging, but CloudWatch and AWS Lambda logging are ruthless when it comes to pricing. Despite the lack of provisional server functions, there are few simple logging practices that are recommended to save time and money on AWS Lambda logging. 

Let’s look at some of these practices.

How do you log Lambda in Python?

To output logs using AWS Lambda logging in Python, we can use the following snippet of code.

Example lambda_function.py

import os

def lambda_handler(event, context):
    print('## ENVIRONMENT VARIABLES')
    print(os.environ)
    print('## EVENT')
    print(event)

Example log format

START RequestId: 8f507cfc-xmpl-4697-b07a-ac58fc914c95 Version: $LATEST
## ENVIRONMENT VARIABLES
environ({'AWS_LAMBDA_LOG_GROUP_NAME': '/aws/lambda/my-function', 'AWS_LAMBDA_LOG_STREAM_NAME': '2020/01/31/[$LATEST]3893xmpl7fac4485b47bb75b671a283c', 'AWS_LAMBDA_FUNCTION_NAME': 'my-function', ...})
## EVENT
{'key': 'value'}
END RequestId: 8f507cfc-xmpl-4697-b07a-ac58fc914c95
REPORT RequestId: 8f507cfc-xmpl-4697-b07a-ac58fc914c95  Duration: 15.74 ms  Billed Duration: 16 ms Memory Size: 128 MB Max Memory Used: 56 MB  Init Duration: 130.49 ms
XRAY TraceId: 1-5e34a614-10bdxmplf1fb44f07bc535a1   SegmentId: 07f5xmpl2d1f6f85 Sampled: true   

Report Log

  • RequestId – The unique request ID used for invocation.
  • Duration – The amount of time your function’s handler method spent on processing the event.
  • Billed Duration – The amount of time billed for the invocation.
  • Memory Size – The amount of memory that is allocated to the function.
  • Max Memory Used – The amount of memory utilized by the function.
  • Init Duration – For the first request served, the amount of time it took the runtime to load the function and run code outside of the handler method.
  • XRAY TraceId – For traced requests, the AWS X-Ray trace ID.
  • SegmentId – For traced requests, the X-Ray segment ID.
  • Sampled – For traced requests, the sampling result.

How to use the AWS Command Line Interface (CLI)

The AWS CLI is an open source tool that allows you to program and interact with the various AWS services provided inside of your command line shell. To follow along, do the following tasks:

  1. Install AWS CLI version 2
  2. Easy and quick configuration with AWS CLI

AWS CLI can be used to retrieve logs from Cloudwatch. Some of the commands to execute to perform the same is given below:

Retrieve an ID

aws lambda invoke --function-name my-function out --log-type Tail

The output is as follows

{
    "StatusCode": 200,
    "LogResult": "U1RBUlQgUmVxdWVzdElkOiA4N2QwNDRiOC1mMTU0LTExZTgtOGNkYS0yOTc0YzVlNGZiMjEgVmVyc2lvb...",
    "ExecutedVersion": "$LATEST"
}

Decode the logs:

aws lambda invoke --function-name my-function out --log-type Tail \
--query 'LogResult' --output text |  base64 -d

The following output
START RequestId: 57f231fb-1730-4395-85cb-4f71bd2b87b8 Version: $LATEST
"AWS_SESSION_TOKEN": "AgoJb3JpZ2luX2VjELj...", "_X_AMZN_TRACE_ID": "Root=1-5d02e5ca-f5792818b6fe8368e5b51d50;Parent=191db58857df8395;Sampled=0"",ask/lib:/opt/lib",
END RequestId: 57f231fb-1730-4395-85cb-4f71bd2b87b8
REPORT RequestId: 57f231fb-1730-4395-85cb-4f71bd2b87b8  Duration: 79.67 ms      Billed Duration: 80 ms         Memory Size: 128 MB     Max Memory Used: 73 MB


The CLI Binary format
#!/bin/bash
aws lambda invoke --function-name my-function --cli-binary-format raw-in-base64-out --payload '{"key": "value"}' out
sed -i'' -e 's/"//g' out
sleep 15
aws logs get-log-events --log-group-name /aws/lambda/my-function --log-stream-name $(cat out) --limit 5

Example for macOS and Linux

chmod -R 755 get-logs.sh

./get-logs.sh

Output

{
    "StatusCode": 200,
    "ExecutedVersion": "$LATEST"
}
{
    "events": [
        {
            "timestamp": 1559763003171,
            "message": "START RequestId: 4ce9340a-b765-490f-ad8a-02ab3415e2bf Version: $LATEST\n",
            "ingestionTime": 1559763003309
        },
        {
            "timestamp": 1559763003173,
            "message": "2019-06-05T19:30:03.173Z\t4ce9340a-b765-490f-ad8a-02ab3415e2bf\tINFO\tENVIRONMENT VARIABLES\r{\r  \"AWS_LAMBDA_FUNCTION_VERSION\": \"$LATEST\",\r ...",
            "ingestionTime": 1559763018353
        },
        {
            "timestamp": 1559763003173,
            "message": "2019-06-05T19:30:03.173Z\t4ce9340a-b765-490f-ad8a-02ab3415e2bf\tINFO\tEVENT\r{\r  \"key\": \"value\"\r}\n",
            "ingestionTime": 1559763018353
        },
        {
            "timestamp": 1559763003218,
            "message": "END RequestId: 4ce9340a-b765-490f-ad8a-02ab3415e2bf\n",
            "ingestionTime": 1559763018353
        },
        {
            "timestamp": 1559763003218,
            "message": "REPORT RequestId: 4ce9340a-b765-490f-ad8a-02ab3415e2bf\tDuration: 26.73 ms\tBilled Duration: 27 ms \tMemory Size: 128 MB\tMax Memory Used: 75 MB\t\n",
            "ingestionTime": 1559763018353
        }
    ],
    "nextForwardToken": "f/34783877304859518393868359594929986069206639495374241795",
    "nextBackwardToken": "b/34783877303811383369537420289090800615709599058929582080"
}

X AWS Lambda Logging Best Practices

One such excessive usage of AWS Lambda logging comes with excessive logging of everything inside Cloudwatch. For example, AWS Lambda charges $0.50 per GB of log ingestion. Doesn’t seem too much until the pile starts to increase. An obvious but seemingly overlooked suggestion is to reduce the amount of logging and printing inside Cloudwatch to save money. 

Every log takes up about 70b of metadata as well as the timestamp and request ID. We can even reduce the same.

A short message of ~50 characters plus metadata gives around 1GB of data for 8 million logs.

If you host nine messages like this that invokes a function that’s called 10 times a second, it produces 1GB log daily. This is $15 per month – which is sustainable. These are, however, the calculations for relatively short logs. If an HTTP request is logged with 10,000 items, then the price may jack up to 100s of dollars. 

Here’s a quick remedy on calculating log ingestions costs

Every AWS Lambda Cloudwatch also creates START, END & REPORT logs for each execution. These are extra 340b of log data for every function invocation. 

Using log levels can be a great way to mitigate the excessive usage of logging inside AWS Lambda.

1. Use a logging library and write logs with severity levels. 

Serverless.yml

custom: logLevelMap: prod: info staging: info logLevel: ${self:custom.logLevelMap.${opt:stage}, 'debug'} provider: environment: LOG_LEVEL: ${self:custom.logLevel}

Logger.ts
const logger = someLoggerLib.createLogger({ level: process.env.LOG_LEVEL || 'info', });

This sets the log level to debug on other environments and info on prod & staging environments.

Setting log retention

Set your log retention to a maximum period of one month. There is no way that the previous ones would be useful in any way. In your serverless.yml file, set the following parameter:

provider: logRetentionInDays: 30

Log as JSON

Cloudwatch appreciates JSON as well. This helps with node Lambda logging as well. Using JSON, you can log into Cloudwatch accordingly: 

{ "level": "info", "message": "Data ingest completed", "data": { "items": 42, "failures": 7 } }
We can filter the logs with a message like this
{ $.message = "Data ingest completed" }

Operations inside Cloudwatch logs insights that can help count the number of failures and more:

{ "level": "info", "message": "Data ingest completed", "data": { "items": 42, "failures": 7 } }
We can filter the logs with a message like this
{ $.message = "Data ingest completed" }

Simple Logger config

Using node lambda functions and node lambda logging, one can use the popular winston library. The way to configure is given below:

  1. Set the log on a level that is provided by an environment variable
  2. Set it up using JSON for easier parsing
  3. Log it with request ID attached to each of the message
  4. Attach optional data
{ "level": "info", "message": "Data ingest completed", "data": { "items": 42, "failures": 7 } }
We can filter the logs with a message like this
{ $.message = "Data ingest completed" }

Summary

These are some of the best practices of AWS lambda logging using Python and Node. 

Also Read: https://cloudlytics.com/a-guide-on-aws-monitoring-tools-for-your-business/

We are now live on AWS Marketplace.
The integrated view of your cloud infrastructure is now easier than ever!