
What is AWS Lambda Logging?
AWS Lambda functions are a special kind of service that allows you to run your code without provisioning them onto servers. Lambda is dynamic in its scalability and can run between a few requests per second to a few thousand per second. Unlike traditional hosting, Lambda functions allow you to pay for the code when it’s running and not when it’s sitting idle. This accounts for a significant decrease in spending and optimizes efficiency as well.
AWS Lambda functions are used when you need to run a function for a short time. Usually, a common application is when you want to pass a function as an argument to a higher-order function.
AWS Lambda logging is a form of automatic monitor of all the lambda functions. AWS Lambda comes with a CloudWatch log that allows you to group your function activity as well as each instance of your function
What does Lambda Logging Include?

Logging your functions in AWS Lambda is pretty straightforward. You write a print message, and it gets added to your Cloudwatch. What follows suit is a surprisingly long bill for simple logging just for the usage of CloudWatch. This may even involve simple debugging, but CloudWatch and AWS Lambda logging are ruthless when it comes to pricing. Despite the lack of provisional server functions, there are few simple logging practices that are recommended to save time and money on AWS Lambda logging.
Let’s look at some of these practices.
How do you log Lambda in Python?
To output logs using AWS Lambda logging in Python, we can use the following snippet of code.
Example lambda_function.py
import os

def lambda_handler(event, context):
    print('## ENVIRONMENT VARIABLES')
    print(os.environ)
    print('## EVENT')
    print(event)
Example log format
START RequestId: 8f507cfc-xmpl-4697-b07a-ac58fc914c95 Version: $LATEST
## ENVIRONMENT VARIABLES
environ({'AWS_LAMBDA_LOG_GROUP_NAME': '/aws/lambda/my-function', 'AWS_LAMBDA_LOG_STREAM_NAME': '2020/01/31/[$LATEST]3893xmpl7fac4485b47bb75b671a283c', 'AWS_LAMBDA_FUNCTION_NAME': 'my-function', ...})
## EVENT
{'key': 'value'}
END RequestId: 8f507cfc-xmpl-4697-b07a-ac58fc914c95
REPORT RequestId: 8f507cfc-xmpl-4697-b07a-ac58fc914c95  Duration: 15.74 ms  Billed Duration: 16 ms Memory Size: 128 MB Max Memory Used: 56 MB  Init Duration: 130.49 ms
XRAY TraceId: 1-5e34a614-10bdxmplf1fb44f07bc535a1   SegmentId: 07f5xmpl2d1f6f85 Sampled: true
Report Log
- RequestId – The unique request ID used for invocation.
- Duration – The amount of time your function’s handler method spent on processing the event.
- Billed Duration – The amount of time billed for the invocation.
- Memory Size – The amount of memory that is allocated to the function.
- Max Memory Used – The amount of memory utilized by the function.
- Init Duration – For the first request served, the amount of time it took the runtime to load the function and run code outside of the handler method.
- XRAY TraceId – For traced requests, the AWS X-Ray trace ID.
- SegmentId – For traced requests, the X-Ray segment ID.
- Sampled – For traced requests, the sampling result.
How to use the AWS Command Line Interface (CLI)
The AWS CLI is an open source tool that allows you to program and interact with the various AWS services provided inside of your command line shell. To follow along, do the following tasks:
AWS CLI can be used to retrieve logs from Cloudwatch. Some of the commands to execute to perform the same is given below:
Retrieve an ID
aws lambda invoke --function-name my-function out --log-type Tail

The output is as follows

{
    "StatusCode": 200,
    "LogResult": "U1RBUlQgUmVxdWVzdElkOiA4N2QwNDRiOC1mMTU0LTExZTgtOGNkYS0yOTc0YzVlNGZiMjEgVmVyc2lvb...",
    "ExecutedVersion": "$LATEST"
}
Decode the logs:
aws lambda invoke --function-name my-function out --log-type Tail \
--query 'LogResult' --output text |  base64 -d

The following output
START RequestId: 57f231fb-1730-4395-85cb-4f71bd2b87b8 Version: $LATEST
"AWS_SESSION_TOKEN": "AgoJb3JpZ2luX2VjELj...", "_X_AMZN_TRACE_ID": "Root=1-5d02e5ca-f5792818b6fe8368e5b51d50;Parent=191db58857df8395;Sampled=0"",ask/lib:/opt/lib",
END RequestId: 57f231fb-1730-4395-85cb-4f71bd2b87b8
REPORT RequestId: 57f231fb-1730-4395-85cb-4f71bd2b87b8  Duration: 79.67 ms      Billed Duration: 80 ms         Memory Size: 128 MB     Max Memory Used: 73 MB


The CLI Binary format
#!/bin/bash
aws lambda invoke --function-name my-function --cli-binary-format raw-in-base64-out --payload '{"key": "value"}' out
sed -i'' -e 's/"//g' out
sleep 15
aws logs get-log-events --log-group-name /aws/lambda/my-function --log-stream-name $(cat out) --limit 5
Example for macOS and Linux
chmod -R 755 get-logs.sh

./get-logs.sh
Output
{
    "StatusCode": 200,
    "ExecutedVersion": "$LATEST"
}
{
    "events": [
        {
            "timestamp": 1559763003171,
            "message": "START RequestId: 4ce9340a-b765-490f-ad8a-02ab3415e2bf Version: $LATEST\n",
            "ingestionTime": 1559763003309
        },
        {
            "timestamp": 1559763003173,
            "message": "2019-06-05T19:30:03.173Z\t4ce9340a-b765-490f-ad8a-02ab3415e2bf\tINFO\tENVIRONMENT VARIABLES\r{\r  \"AWS_LAMBDA_FUNCTION_VERSION\": \"$LATEST\",\r ...",
            "ingestionTime": 1559763018353
        },
        {
            "timestamp": 1559763003173,
            "message": "2019-06-05T19:30:03.173Z\t4ce9340a-b765-490f-ad8a-02ab3415e2bf\tINFO\tEVENT\r{\r  \"key\": \"value\"\r}\n",
            "ingestionTime": 1559763018353
        },
        {
            "timestamp": 1559763003218,
            "message": "END RequestId: 4ce9340a-b765-490f-ad8a-02ab3415e2bf\n",
            "ingestionTime": 1559763018353
        },
        {
            "timestamp": 1559763003218,
            "message": "REPORT RequestId: 4ce9340a-b765-490f-ad8a-02ab3415e2bf\tDuration: 26.73 ms\tBilled Duration: 27 ms \tMemory Size: 128 MB\tMax Memory Used: 75 MB\t\n",
            "ingestionTime": 1559763018353
        }
    ],
    "nextForwardToken": "f/34783877304859518393868359594929986069206639495374241795",
    "nextBackwardToken": "b/34783877303811383369537420289090800615709599058929582080"
}
X AWS Lambda Logging Best Practices

One such excessive usage of AWS Lambda logging comes with excessive logging of everything inside Cloudwatch. For example, AWS Lambda charges $0.50 per GB of log ingestion. Doesn’t seem too much until the pile starts to increase. An obvious but seemingly overlooked suggestion is to reduce the amount of logging and printing inside Cloudwatch to save money.
Every log takes up about 70b of metadata as well as the timestamp and request ID. We can even reduce the same.
A short message of ~50 characters plus metadata gives around 1GB of data for 8 million logs.
If you host nine messages like this that invokes a function that’s called 10 times a second, it produces 1GB log daily. This is $15 per month – which is sustainable. These are, however, the calculations for relatively short logs. If an HTTP request is logged with 10,000 items, then the price may jack up to 100s of dollars.
Here’s a quick remedy on calculating log ingestions costs
Every AWS Lambda Cloudwatch also creates START, END & REPORT logs for each execution. These are extra 340b of log data for every function invocation.
Using log levels can be a great way to mitigate the excessive usage of logging inside AWS Lambda.
1. Use a logging library and write logs with severity levels.
Serverless.yml

custom: logLevelMap: prod: info staging: info logLevel: ${self:custom.logLevelMap.${opt:stage}, 'debug'} provider: environment: LOG_LEVEL: ${self:custom.logLevel}

Logger.ts
const logger = someLoggerLib.createLogger({ level: process.env.LOG_LEVEL || 'info', });
This sets the log level to debug on other environments and info on prod & staging environments.
Setting log retention
Set your log retention to a maximum period of one month. There is no way that the previous ones would be useful in any way. In your serverless.yml file, set the following parameter:
provider: logRetentionInDays: 30Log as JSON
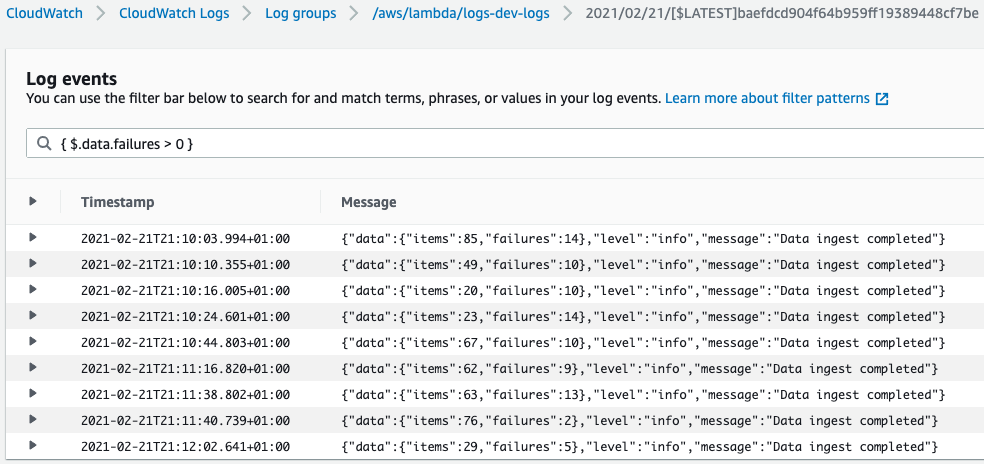
Cloudwatch appreciates JSON as well. This helps with node Lambda logging as well. Using JSON, you can log into Cloudwatch accordingly:
{ "level": "info", "message": "Data ingest completed", "data": { "items": 42, "failures": 7 } }
We can filter the logs with a message like this
{ $.message = "Data ingest completed" }
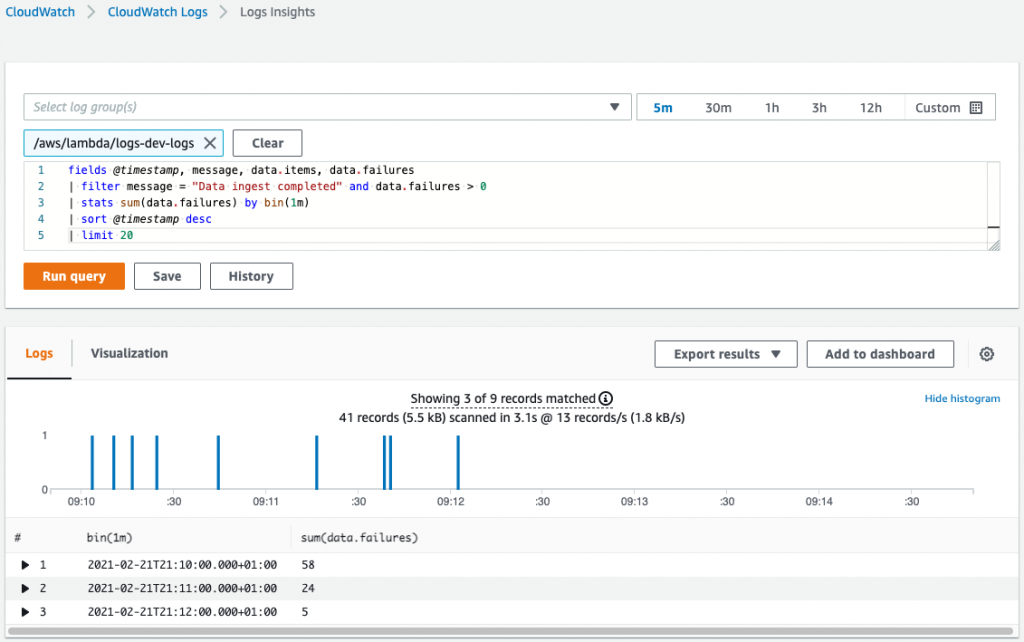
Operations inside Cloudwatch logs insights that can help count the number of failures and more:
{ "level": "info", "message": "Data ingest completed", "data": { "items": 42, "failures": 7 } }
We can filter the logs with a message like this
{ $.message = "Data ingest completed" }
Simple Logger config
Using node lambda functions and node lambda logging, one can use the popular winston library. The way to configure is given below:
- Set the log on a level that is provided by an environment variable
- Set it up using JSON for easier parsing
- Log it with request ID attached to each of the message
- Attach optional data
{ "level": "info", "message": "Data ingest completed", "data": { "items": 42, "failures": 7 } }
We can filter the logs with a message like this
{ $.message = "Data ingest completed" }
Summary
These are some of the best practices of AWS lambda logging using Python and Node.
Also Read: https://cloudlytics.com/a-guide-on-aws-monitoring-tools-for-your-business/