Python Logging Basic – What You Need To Know

Logging is an important part of building an application, especially today when there are multiple fronts involved in making a single solution. As the development complexities increase, effective management is the key to ensure the intended results. 

Using logs while building a solution helps with debugging and sorting out the application issues while keeping a check on its performance throughout the development cycle. Python comes with a logging module with some of the most-used logging features making it easier for developers to record the workings of the development cycle. 

Here’s a detailed excerpt on python logging, its features, and its implementation. 

What is Python Logging?

Python Logging represents an event tracking mechanism while an application or software runs. Developers use logging to identify the underlying cause of a problem in case the program or software crashes. 

Without logging, locating the cause of a crash or bug is not easy. Logging helps you follow a trail of crashes and issues that lead to the main issue causing crashes and other performance errors in the application or software. 

Not using Python logging complicates finding any sort of bugs or errors in the developed solution. 

Every event recorded and described via logging contains variable data. This data is potentially different for each log created, and it’s connected to the event occurrence. Furthermore, in Python, the developers can also prescribe each logged event with a level or severity of the case. 

How do you log in Python?

Python has an in-built logging module available in the Python Standard library accessible to the developers. To log to a console, program, or file, you need to write the basic command with logging.basicConfig(). 

Within the brackets, you need to fill the level and the message, which will be visible at the console and readable by anyone looking at the logs at a later time. 

For logging, you need loggers, which are basically entities that a developer can create and configure to record the log messages in different formats. 

Loggers help organize the logging reports as they can be edited to send reports to a file with a different logging level connected to a specific module. It’s the person working with the Python logging format who needs to understand the module and logging level. 

The Logging Module

The Python logging module is an all-powerful tool catering to the logging needs of beginners and that of enterprises. A logging module can be integrated with third-party Python libraries. 

Since there isn’t one third-party integration, the logging module collaborates the logs from all of them to create a common log for the entire application. 

It makes identifying the errors, causes, and other essential events in the solution simpler, faster, and more efficient. 

Getting the module onboard is done by a simple code fragment import logging

Once the logging module is imported, you can use the logger to create and record messages readable by others on the team. 

Adding events on the logger is generally oriented under five levels indicating their severity. The Python logging levels are DEBUG, INFO, WARNING, ERROR, and CRITICAL. The names of these levels are self-explanatory, and the intended reader is supposed to work on the part of the code script, which has been added along with the level. 

To understand it better, follow the Python logging example below;

Import logging

Logging.debug( ‘debug xyz’ )

Logging.info( ‘working as expected’ )

Logging.warning( ‘disk space low’ )

Logging.error( ‘carousel not performing’ )

Logging.critical( ‘login function unresponsive’ )

The output of the above Python logging format will look like this;

DEBUG:root: debug xyz

INFO:root: working as expected

WARNING:root: disk space low

ERROR:root: carousel not performing

CRITICAL:root: login function unresponsive

From Debug to Critical, each level’s severity increases subsequently, and the developers accessing the logs must work to resolve the critical logs first and then moving upwards to Debug. 

Basic Configurations

Let’s see about a couple of configurations in Python logging. The purpose of configuring the log messages is to ensure that they go to their intended place or target. 

The Python logging module that we just talked about above gives you plenty of ways to do this, so rest assured that the configuration is simple. 

The severity level functions debug, info, error, warning, and critical will automatically call basicConfig() if they have an undefined handler in their logger. 

Basic configurations are executed under some common parameters, including level, filename, filemode, and format. 

The level is severity level (talked about above), and the filename is the file to which the message is logged. Filemode tells in which mode the file will open (by default, it’s an append). 

Lastly, the format is meant to show the format of the log message. 

Here’s an example of how the basic configuration will look like with a severity level added. 

logging.basicConfig(level=logging.DEBUG)

logging.debug( ‘This will be logged’ )

Formatting the output

There are no limitations to adding a string from the existing application you are building to relay a message to the logs. Having said that, some basic elements have already been added to LogRecord, and they can be used within the output format you are creating for the Python logging message board. 

Another thing to note here is the formatter is already set to continue to use; if not, you can always use the default formatter for the output. 

Here is what the default formatter goes like;

BASIC_FORMAT = “%(levelname)s:%(name)s:%message)s”

While this is the default string, the log recorder can take any sort of string compatible with LogRecord. You will find the entire list of usable attributes here (start looking from 1640).

Classes and Functions

Classes and Functions in Python logging are present if there are multiple modules of the application, which normally is the case almost every time. So, identifying these classes and functions as well as their importance is essential. 

The root logger is the default string used in python logging format, but you must make an effort to define your logger with additional classes and functions. 

Here are some common strings you will need to build appropriate record logs. 

  • Logger: Used directly to call the functions in the application code. 
  • LogRecord:  The good thing here is that the Python loggers will automatically create LogRecord objects. They will do so provided that the loggers has everything about the event that is being logged. 
  • Handler: The Handler is used to direct the LogRecord to its desired direction or output. It can be a console or a file. Handler is the base from which you can take out subclasses of strings, including StreamHandler, FileHandler, HTTPHandler, etc. 
  • Formatter: The Formatter is self-explanatory. You will use this function to set the Python logging format or specify a string to take a specified format. 

How is Python Logger Implemented?

Implementing a Python logger means using the strings and commands given above with the help of the logger module. Implementing it shows the sequential process of making a log and then ensuring its intended output. 

You start with creating a logger with logger=logging.getlogger(nm), here ‘nm’ is the filename. Next, you need to read the log-level from the properties file, which goes in a .txt format, and you must also set the levels here. 

Next up, set the format with the Formatter function followed by creating Handlers and then adding the Formatters to those Handlers. The process completes by adding Handlers to the logger. 

How do you create a Log File in Python?

To create a log file in Python, you need to use the import string and add additional strings according to your requirements. Python developers don’t use the log file much as of today as they create Syslog to write messages to a specific file. 

Making a log file means that you need to write the strings in a manner that makes detection of the file and the messages easy. For additional help, you can use logrotate or WatchedFileHandler for better event tracking and rotating the log files. 

Conclusion

Python logging is a simple and standard exercise practised by every kind of Python developer. It has a robust logging framework along with a well-established library of strings that can be used to create a Python console log. 

While using the Python logger, you need to learn how to simplify it and make it more understandable for everyone on the team. 

FAQs

How do you read a log file in Python?

To read a log file in Python, open it first by defining the log_file_path, and then for reading, type “r.” You can assign the data in the file with a file variable and type in for line in file to gain access to every line in the file. Similarly, you can look for text with re.finditer.  

How to use console Log in Python?

The Python console log can be opened by pressing Ctrl+Alt+S and then navigating to Keymap. Here you can specify a shortcut that will help open the Main menu | Tools | Python or Debug Console. 

The console log is operable with the up and down arrow keys. You will also find the previously executed commands in the log and repeat them according to the requirements. 

How to use Math Log in Python?

The module math gives access to several logarithmic functions in Python that you can embed in your code script. For using the math log, you need to start the string with math followed by the mathematical function you want to add. 

This can be log(a,Base); log2(a); ValueError; log10(a), etc. 

How to log transform data in Python?

Start by installing and importing NumPy in Python and then apply a natural log transformation function as numpy.log or np.log. These two functions must be applied to the values that needed to be transformed. 

How to parse a Log File in Python?

Parsing more than one line in Python needs a different process than for match in line string that we commonly use. Parsing in Python logging helps read a block of data or content, which is done with data=f.read(). 

How to log data in Python?

Logging data in python is done with the same process you use for logging other types of information and messages. While doing so, make sure to denote the right level, output and give it the proper formatting. 

Can Python be used to perform Log File Analysis?

You can, but that must be done with a separate library of tools called Python Pandas. The library has data structures like DataFrames that can be used for the purpose. 

Hadoop vs Spark: A Comparative Study

In an increasingly connected world, real-time information has become critical to all businesses. To extract, store and analyse heaps of information efficiently, data has to be stored in a scalable manner that allows the business to respond in real-time. Apache Spark and Hadoop were built for precisely this purpose.

Apache Hadoop is an open-source software library that enables reliable, scalable, distributed computing. Apache Spark is a popular open-source cluster computing framework within the Hadoop ecosystem. Both entities are useful in big data processing. They both run-in distributed mode on a cluster.

Hadoop and Spark are two popular open-source technologies making our lives simpler today. They have always been close competitors with their own fan base in the world of data analytics. 

Interestingly, both are Apache projects with a unique set of use cases. Though both have a wide array of advantages and disadvantages, they are still pretty easily comparable to decide which one is better for your business.

Let us dive deep and try to understand what these two technologies stand for, through a thorough analysis of their benefits and use cases.

What is Hadoop? 

The Apache Hadoop project has been around for a while, but its origins lie in the late 1990s. Doug Cutting and Mike Cafarella created it at Yahoo. Ever since then, it’s become one of the most widely used distributed file systems in the world.

The Hadoop framework is written in Java and enables scalable processing of large data sets across clusters of commodity hardware, leading to high-performance computing. In simple terms, Hadoop is a way to store and process data in an easy, cost-effective way. Hadoop uses a distributed processing model that allows users to access the information they need without storing it on a single machine. 

It is used for distributed storage and database management by businesses, governments, and individuals. Hadoop can also be considered a cluster computing platform that uses the MapReduce programming model to process big data sets.  

Hadoop was created mainly to address the limitations of traditional relational databases and provide faster processing of large data sets, particularly in the context of web services and internet-scale applications.

The four major modules of Hadoop are:

  1. Hadoop Distributed File System (HDFS): This system stores and manages large data sets across the clusters. HDFS handles both unstructured and structured data. The storage hardware that is being used can be anything from consumer-grade HDDs to enterprise drives.
  2. MapReduce: MapReduce is the processing component in the Hadoop ecosystem. The data fragments in the HDFS are assigned to separate map tasks in the cluster. MapReduce processes teh chunks to combine the pieces into the desired result.
  3. Yet Another Resource Negotiator: YARN is responsible for managing job scheduling and computing resources.
  4. Hadoop Common: This module is also called Hadoop Core. It consists of all common utilities and libraries that other modules depend on. It acts as a support system for other modules.

Image Source

What is Spark? 

Apache Spark is an open-source project by Databricks and supports the processing of fast data sets in real-time. Databricks provides Spark as a service and now offers more than 100 pre-built applications in different domains. It’s used for interactive queries, machine learning, big data analytics and streaming analytics.

Spark is a fast and easy-to-use in-memory data processing framework. It was developed at UC Berkeley as an extension of the big data ecosystem that has been supported by Hadoop, Apache HBase, Hive, Pig, Presto, Tez, and other components since its inception. Spark engine was created to boost the efficiency of MapReduce without compromising its benefits. Spark uses Resilient Distributed Dataset (RDD), which is the primary user-facing API.

It provides an optimised distributed programming model in which computations are carried out in a distributed manner on clusters of machines connected by high-speed networks. Its technology is specially devised for large-scale data processing. It reduces the task of handling huge amounts of data by breaking it into smaller tasks that can be processed independently. 

It also offers a distributed computing framework based on Java for big data processing. Spark uses Scala and Python programming languages, and it is open source. 

The Five Major Components of Apache Spark – 

  1. Apache Spark Core: This component is responsible for all the key functions like task dispatching, scheduling, fault recovery, input and output operations, and much more. Apache spark core acts as a base for the whole project, and all functionalities are built on it. 
  2. Spark streaming: As the name suggests, this component enables the processing of live data streams. The live stream data can originate from any of the sources like Kinesis, Kafka, Flume, etc.,
  3. Spark SQL: In this component, Spark gathers all information about the structured data and processing information of the data structures.
  4. Machine Learning Library (MLLib): This component consists of a vast library of machine learning algorithms. The goal of a machine learning library is to make it scalable and make machine learning more accessible.
  5. GraphX: It consists of a set of APIs that can be used for facilitating graph analytics tasks.

Image Source

Hadoop vs Spark: Key Differences

Hadoop is a mature enterprise-grade platform that has been around for quite some time. It provides a complete distributed file system for storing and managing data across clusters of machines. Spark is a relatively newer technology with the primary goal to make working with machine learning models easier.

Apache Hadoop and Apache Spark are the two giants in the big data world. While many of us cannot tell the exact difference between them, understanding them is pretty important. Both have their pros and cons; it all depends upon what you are looking for and what your needs are.

Both are distributed computing solutions and each has value in the right circumstances. Choosing between Hadoop and Spark can be a difficult task, as there is no easy “winner” or black-and-white answer to the question. The best approach for your business will likely depend on what you are currently working with, your team’s skill sets, and your long-term strategy.

Let’s now look into the differences between Hadoop and Spark on different parameters – 

Performance

Performance is the most important metric that drives the success of any data analytics software and platform. The performance of Hadoop and Spark has been a major topic of debate since the release of Apache Spark. But how different is the performance one from the other? Is one better than the other? Is it even possible to compare Hadoop and Spark?

Performance comparison between Hadoop and Spark is inevitable. Unfortunately, comparing them based on performance is not as easy as we would like to believe. Several factors contribute to performance in a big data environment, including software choice, hardware capabilities, number of nodes used, storage availability etc.

Hadoop Boosts the overall performance when it comes to accessing the locally stored data on HDFS. But when it comes to in-memory processing, Hadoop can never match with Spark. Apache claims that when using adequate RAM for computing, Spark is 100 times faster than Hadoop through MapReduce. 

In 2014, Spark set a new world record in sorting the data on disk. Spark was able to dominate Hadoop by being three times faster and using 10 times fewer nodes to process 100TB data on HDFS.

The main reason for Spark’s high performance is that it doesn’t write or read the intermediate data to the storage disks. It instead uses RAM to store the data. On the other hand, Hadoop stores the data on many different levels. After this, the data is processed in batches using MapReduce.

Spark might seem to be a complete winner here. However, if the size of data is larger than the available RAM, then Hadoop will be the more logical choice. 

Cost

A recent article published by IT consultancy firm Frost & Sullivan said that Hadoop continues to generate a positive Return On Investment (ROI) for enterprises. The same firm also predicted that Spark is poised to expand its market share in the enterprise computing space.

Directly comparing the price between these two big data processing frameworks is a very simple task. Since both the platforms are open-source, they are completely free. But the organisation must factor in the infrastructure, development, and maintenance cost to get the Total Cost of Ownership (TCO).

When it comes to hardware, Hadoop works on any type of data storage device for processing data. This makes the hardware cost for Hadoop relatively low. Apache spark, on the other hand, relies on in-memory computation for its real-time data processing. Spark typically requires spinning up plenty of nodes, which, in turn, require lots of RAM. This makes hardware cost for Spark relatively higher.

Finding a resource for application development is the next significant factor. Since Hadoop has been around for a long time now, it is easy to find experienced software developers. This makes the demand slightly lower; hence you have to shell out a lesser remuneration. It’s not the same case with Spark, where it is a tad more difficult to find resources. 

It is important to note that even though Hadoop seems to be relatively cost-effective, Spark processes data at a much faster rate, making the ROI almost similar.

Data Processing

Both the frameworks process data in a distributed environment; Hadoop does it with MapReduce, while Spark executes it with RDDs. Both handle data in different ways. But, when it comes to real-time processing, Spark shines out. However, Hadoop is the ideal option for batch processing.

The Hadoop process is pretty simple — it stores the data in a disk and analyses the data in parallel in batches over a distributed system. MapReduce, on the other hand, can handle large amounts of data with minimal RAM. It relies only on hardware storage. Hence it is best suited for linear data processing. 

Apache Spark works with RDD. It is a set of elements stored across the clusters in the partition of nodes. The RDD’s size is usually too large for a single node to handle. So Spark partitions RDD in the closest node and performs the operation in parallel. Directed Acyclic Graph (DAG) is used in the system to track all RDD performances.

With high-level APIs and in-memory computation, Spark can handle live streams of unstructured data very effectively. The data is stored in several partitions. A single node can have many partitions, but a single partition cannot be expanded to another node.

Fault Tolerance

Both the frameworks provide a reliable solution to handle failures. The fault-tolerance approaches of both systems are quite different.

Hadoop provides fault tolerance based on its operation. The Hadoop system replicates the same data multiple times across the nodes. When an issue arises, the system resumes work by filling missing blocks from other locations. There is a master node that tracks all the slave nodes. If a slave node doesn’t respond to the master node’s pinging, the master node assigns the remaining job to another slave node.

In Spark, tolerance is handled by RDD blocks. The system can track the creation of an unchangeable dataset. It restarts the process when there is an error in the system. Spark uses DAG tracking of the workflow to rebuild data in clusters. Hence this system enables Spark to handle issues in a distributed data processing system.

Scalability

Hadoop rules this section. Remember, Hadoop uses HDFS to deal with big data. As the data keeps growing, Hadoop can easily accommodate the rising demand. On the other hand, Spark doesn’t have a file system, it has to rely on HDFS when handling large data. This makes it less scalable.

The computing power can be easily expanded and boosted by adding more servers to the network. The number of nodes can reach thousands in both frameworks. There is no theoretical limit on how many servers can be added to clusters and how much data can be processed.

Studies show that in the Spark environment, 8000 machines can work together with petabytes of data. On the other hand, Hadoop clusters can accommodate tens of thousands of machines with data close to exabyte.

Ease of Use and Programming Language Support

Spark supports multiple programming languages like Java, Python, R, and Spark SQL. This makes it more user-friendly and allows developers to choose a programming language that they are comfortable with.

Hadoop’s framework is based on Java, and it supports two main programming languages to write MapReduce code: Java and Python. The user interface of Hadoop is not that interactive to aid users. But it allows developers to integrate with Hive and Pig tools to enable writing complex MapReduce programs.

Apart from its support for APIs in multiple languages, Spark is also very interactive. The Spark-shell can be used to analyse the data interactively with Python or Scala. The shell also provides instant feedback to queries.

Programmers can also reuse existing code in Spark, which reduces application development time for developers. In Spark, the historic and stream data can be combined to make the process more effective.

Security

Hadoop seems to have the upper hand when it comes to security. To make matters worse, the default security feature is set to ‘Off’ in Spark. Spark’s security can be amped up by introducing authentication via event logging or shared cost. However, this is not sufficient for the production workloads.

Hadoop has multiple authentication features. The most difficult one to implement is Kerberos authentication. Other authentication tools that Hadoop supports include Ranger, ACLs, Service level authorisation, inter-node encryption, LDAP, and standard file permission on HDFS. Apache Spark has to integrate with Hadoop to reach an adequate level of security.

Machine Learning

Since machine learning is an iterative process, it works best in in-memory computing. Hence Spark shows more promise in this area.

Hadoop’s MapReduce splits jobs into parallel tasks. This makes it too large for data science machine learning algorithms to handle. This creates an I/O performance issue in Hadoop applications. The main machine learning library Mahout in Hadoop relies on MapReduce to perform classification, clustering, and recommendation.

Spark has a default machine learning library that can perform iterative in-memory computation. Spark also has data science tools to perform classification, pipeline construction, regression, evaluation, persistence, and more.

Spark is the best choice for machine learning. MLlib is nine times faster than Apache Mahout in a Hadoop disk-based environment. 

Resource Management and Scheduling

Hadoop uses external solutions for scheduling and resource management as it doesn’t have an inbuilt scheduler. In a Hadoop cluster with node manager and resource manager, YARN is responsible for resource management. Oozie is a tool available for scheduling workflows in Hadoop.

Hadoop MapReduce works with scheduler plugins like Fair Scheduler and Capacity Scheduler. These schedulers make sure that the cluster’s efficiency is maintained with essential resources.

Spark has these functions inbuilt. The operations are divided into stages using DAG Scheduler in Apache Spark. Every stage has multiple tasks to execute which are handled by Spark and DAG scheduler.

Using Hadoop and Spark together 

Both the frameworks are unique and come with lots of benefits. These platforms can do wonders when used together. Hadoop is great for data storage, while Spark is great for processing data. Using Hadoop and Spark together is extremely useful for analysing big data. You can store your data in a Hive table, then access it using Apache Spark’s functions and DataFrames. These are the two major components of Apache Spark that enable you to analyse big data in real-time.

The Spark framework is intended to enhance the Hadoop framework and not to replace it. Hadoop developers can boost their processing capabilities by combining Spark with HBase, Hadoop MapReduce, and other frameworks.

Spark can be integrated into any Hadoop framework like Hadoop 1.x or Hadoop 2.0 (YARN). You can integrate Spark irrespective of your administrative privilege to configure the Hadoop cluster. To sum up, there are three ways to deploy Spark in your Hadoop framework: YARN, SIMR, and standalone.

Uses Cases of Hadoop

Hadoop has a wide range of applications, such as market analysis, scientific research, financial services, web search, and e-commerce. Let us look into them – 

  • Hadoop is the go-to platform for an organisation that requires the processing of large datasets. Typically, it is a befitting choice for any scenario where the data size exceeds the available memory.
  • When it comes to handling large data, financial sectors cannot be ignored. The use of data science is very prominent in this sector. They often use large data to analyse and assess risks, create trading algorithms, and build investment models. Hadoop has been a huge help to build and run these models successfully.
  • If you are low on budget, then Hadoop is the right and effective framework to choose. It allows you to build data analysis infrastructure on a low budget.
  • Retailers often analyse a large set of structured and unstructured data to understand their audience and serve their customers in a much better way. Hadoop is a great go-to tool for these retailers.
  • Hadoop can also be used in organisations where time is not a constraint. If you have large datasets to be processed and you don’t want it immediately, then Hadoop could be your choice. For example, eCommerce sites can use Hadoop to boost their engagement rate.
  • Suppose your organisation depends on large machinery, telecommunication, or a large fleet of vehicles. In that case, you can send all the big data from the Internet of things (IoT) devices to Hadoop for analysis. Hadoop-powered analytics will make sure all your machinery is scheduled for preventive maintenance at the right time.

Use Cases of Spark

Here are some scenarios and situations where Spark can be used instead of Hadoop – 

  • If real-time stream data processing and analysis are essential for an organisation, then Apache spark is the go-to option for you.
  • Spark is enabled with an in-memory computation feature that allows organisations to get all the results in real-time. So industries in which real-time results make a difference can leverage the Spark framework.
  • The iterative algorithm in Spark helps to deal with chains of parallel operations. Organisations that are dealing with multiple parallel operations can use this tool to their benefit.
  • There is a library of machine learning algorithms available with Spark. This enables you to use high-level machine learning algorithms in processing and analysing your datasets.
  • Apache Spark can be used in health care services. Healthcare providers are using Apache Spark to analyse patients’ records and the past clinic data in real-time.
  • The gaming industry has also started utilising Spark. Spark analyses the users in real-time and in various game events to suggest lucrative targeted advertising.

Summary

In this post, we have seen the key difference between Hadoop and Spark. Hadoop typically allows you to process and analyse large data sets that can exceed the drive capacity. It is primarily used for big data analysis. Spark is more of a general-purpose cluster computing framework developed by the creators of Hadoop. Spark enables the fast processing of large datasets, which makes it more suitable for real-time analytics.

In this article, we went over the major differences between Hadoop and Spark, the two leading big data platform of choice. We also laid some ground work for which you should use over another and when.

To conclude, Spark was developed with the intention to use it as a support to boost Hadoop’s functionality. When both frameworks are used together, you can enjoy the dual benefits of both. 

Looking for the perfect cloud-driven security for modern enterprises? Cloudlytics has got the perfect solution for you. Contact us now for any queries.

List of Best AWS Monitoring Tools in 2023

The pandemic has pushed the envelope for cloud adoption in several organizations in a big way. While this is a great approach, cloud adoption can be challenging if the ROI is not measured. According to a report, global cloud spending will reach $332.3 billion by the end of 2021, growing at a rate of 23.1%. 

One of the most prominent cloud service providers is Amazon Web Service (AWS). It provides a massive pool of cloud-based services ranging from database service to computing and even cloud-native environments for development purposes. 

AWS monitoring is essential for your organization to ensure maximum ROI and efficiency. So, here is a comprehensive guide on AWS monitoring tools and processes. But, before we get into that let’s start with what is AWS monitoring.

What is Cloud Monitoring?

Cloud monitoring is a crucial part of maintaining a healthy cloud application infrastructure. If you are not monitoring your cloud use, you could be spending more than you can afford and this can cause problems with security and continuity. Cloud applications are great, but they can add up quickly in terms of cost, if not carefully monitored. When used properly however, the savings can be miraculous.

Most system administrators can agree that monitoring and log analysis are key elements to managing infrastructure services. A monitoring solution will help you to predict performance issues, investigate incidents, identify the root cause of problems and observe trends. In this post, I’ve gathered the most common monitoring tools for AWS.

What is AWS Monitoring?

AWS monitoring is the systematic observation, inspection, and real-time tracking of cloud-based resources offered by AWS. It also involves monitoring and management of dynamic cloud environments in real-time.

This process involves a set of best practices being executed to verify the functionality, security, and performance of the AWS assets as per pre-defined standards. AWS monitoring is about observing the resources and includes logging, tracking, and generating tickets on specific errors. 

The key benefit of AWS monitoring is that it offers better control of the resources for optimised costs. For most of the AWS services like Elastic Compute Cloud(EC2), you need to pay as per the instances of use. So, AWS monitoring ensures that there is no wastage of resources. 

Apart from the cost, there are several reasons to monitor your AWS resources, such as

  • Allows you to ensure compatibility of legacy systems with a cloud environment
  • Allows you to analyze the infrastructure for regulatory issues, different metrics, inventory, log files, complexity, and any security breaches
  • With the shared responsibility model of AWS, you need to take care of security within the cloud service, which only needs effective monitoring
  • More visibility of your AWS resources through a centralised monitoring approach
  • Helps you detect any anomaly in the system, which can lead to massive security issues
  • Early detection of errors reducing downtime and improving availability

Monitoring is a critical component of a continuous delivery pipeline for every business. While monitoring and logging are also core services on Amazon Web Services, you need to rely on other vendors for application-specific business needs like detailed logs and alerts. We have listed down the most popular AWS monitoring tools to help you handle this requirement.

Benefits of AWS Monitoring Tools

AWS tools can help you monitor the health of your AWS environment, identify potential bottlenecks or failures, and provide a dashboard for the status of your resources. They track the performance, availability and usage of an AWS application or service. This gives insights on how to optimize your infrastructure to improve performance as well as identify problems in your infrastructure before they escalate into major production outages.

AWS provides a lot of tools that are used by developers to monitor and manage cloud resources. You can use these tools to automate and schedule tasks such as scaling up/down, load balancing, and autoscaling.

AWS Monitoring Tools are software and tools that provide the visibility and control to monitor AWS resources. They can be used for a variety of purposes, including:

  1. Monitoring usage of AWS resources
  2. Alerting when an alarm has been triggered
  3. Troubleshooting problems with your AWS environment
  4. The monitoring tools can be used by developers, operators, administrators, and security professionals to detect potential issues in their infrastructure.

In short, AWS monitoring tools are used to monitor the cloud service of Amazon Web Services. The tools provide essential insights about the system’s performance and about the availability of various services. They also help with capacity planning, application performance management, and resource utilization.

What are the Best Monitoring Tools in AWS?

Let’s discuss some of the best AWS monitoring tools that you can use.

First-party Monitoring Tools

First-party AWS monitoring tools are either built-in or offered as an add-on by AWS. They help you manage resources, track metrics and even enhance the performance of AWS services.

AWS Cloudtrail

CloudTrail is an in-built service that comes with AWS and is activated when you login into your account. It allows you to monitor different activities of your account and enhance performance. CloudTrail records every activity and offers insights into other parameters. You can easily view every event through the console accessing the event history. 

An event history allows you to view activities, search specific entries and even download logs from the past 90 days. In addition, you can create a trail to archive data, analyze information and respond to sudden changes in the system. Such trails are configurations that will help AWS services deliver events to the Amazon S3 bucket specified by you.

However, CloudTrail is not the only service that AWS offers for event tracking. You can leverage other first-party AWS monitoring tools like Cloudwatch.

AWS Cloudwatch

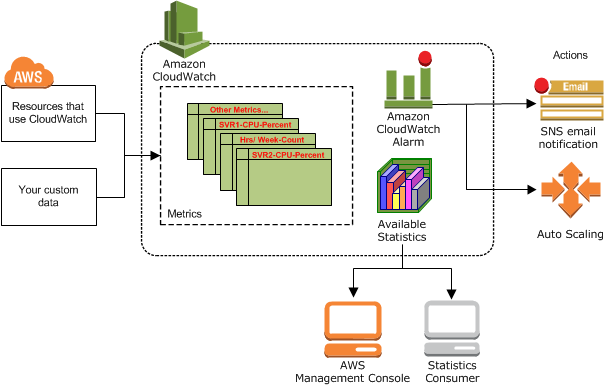
The Amazon CloudWatch service provides a range of monitoring options that you can use to monitor your AWS resources. The Amazon CloudWatch dashboard is an easy-to-use web application that allows users to view their AWS resources in one place. You can also create alarms that trigger notifications when certain conditions are met, such as when an instance’s CPU utilization exceeds 75%. That’s why AWS is a leader in the cloud-monitoring space: it offers all sorts of services that help you keep an eye on your AWS resources.

AWS Cloudwatch is a repository of metrics that allows you to retrieve information regarding different services. For example, Amazon EC2 places the metrics into the repository. You can receive insights into the performance of the AWS services based on these metrics. 

It allows you to leverage the metrics to calculate different statistics and then present them through the Cloudwatch console. The best part about Cloudwatch is real-time alerts that you can configure through Amazon SNS(Simple Notification Service)3 to offer email notifications or even SMS. You can even create a function to trigger auto-scaling of Amazon EC2 services through Cloudwatch based on traffic. 

Another way to optimise Amazon EC2 is by monitoring it through the pre-built dashboard. 

Amazon EC2 Dashboard

Amazon EC2 offers scalable and flexible computing power within the AWS cloud environment. The best part about Amazon EC2 is its pricing structure that depends on the instances of use. In addition, it allows you to configure several virtual servers with enhanced security, networking, and storage management.

So, it becomes vital to monitor different aspects like instances, network activities, security, and others. EC2 dashboard provides several resources that can help you launch and monitor each instance. In addition, you can track instance status for effective EC2 monitoring and overall health of different services, manage alerts, and even track scheduled events.

However, you need to manage several critical certifications like SSL/TLS certificates and other licensing issues when it comes to security monitoring. This is where a certificate manager can help you manage all the certifications.   

Certificate Manager

It is a tool that allows you to manage different security certifications and monitor their efficiency. For example, secure sockets layer (SSL) or transport layer security (TLS) certificates are encryption-based protocols that help encrypt the communication between the browser and the server for secure data exchange. 

A certificate manager will allow the addition, installation, activation, and management of such certification for your systems.

Apart from these first-party tools, there are several third-party AWS monitoring tools that you can leverage to monitor resources. 

Third-party AWS Monitoring Tools

AWS offers several tools to monitor its performance, and they are great for specific functionalities. However, third-party monitoring tools offer what these tools lack. Here are some of the best third-party monitoring tools.

SolarWinds Server & Application Monitor

When it comes to finding the most comprehensive third-party AWS monitoring tool, SolarWinds server and application monitor is a great option. The best part about this tool is that it helps you monitor AWS services and Microsoft Azure resources, PaaS, IaaS, and other such services.

It allows server performance monitoring for public, private, and even hybrid environments. In addition, the service and Application Manager will enable you to monitor any service easily and even create custom templates for the presentation of statistics.

Manage Engine Application Manager

Application Manager from Manage Engine collects all the data related to resources and performance like logs, metrics, events, etc. Further, it provides a unified presentation of all this data from different applications that run on AWS. 

Administrators can leverage this tool to perform several monitoring tasks like tracking multiple instances, measuring cloud-based performance metrics, CPU usage, network traffic, latencies, memory, and even offer recommendations to achieve optimal results. 

ZenPack

ZenPack is an open-source tool that can help you vire vital metrics through a user-friendly graphical interface. It aggregates data related to metrics from different AWS services like S3, Amazon Virtual Private Cloud (VPC), and Amazon Suite.

Zabbix

It is another open-source AWS monitoring tool that collects metrics from different resources, applications, and databases. Zabbix offers a feature-rich dashboard with a massive online community that offers reliable support. However, there is one drawback with the tool where you can’t import data or even generate analytic reports.

Zabbix has a ton of features that makes it one of the top monitoring tools. With its agent-less approach, you can monitor practically anything, on any OS. This is made possible with checks, which are scripts that Zabbix runs to retrieve information. It comes bundled with over 100 checks, and you can easily make your own to collect the data you require. Its flexible data storage allows you to save it in several ways, such as time series, historical data or logs. You can then analyze and create graphs on this data in order to spot trends and determine root causes.

While all of these tools are great ways to track the performance of applications running on AWS services, Cloudlytics is a monitoring tool that provides enhanced analytics.

How does Cloudlytics help with AWS Monitoring?

Cloudlytics is arguably the most significant AWS cloud monitoring tool. After all, what can be more important than security. And that is exactly what Cloudlytics offers as a Cloud Security Posture Management (CSPM) tool. It offers insights into metrics for different services and enables the processing of AWS logs. It supports various services like Amazon Simple Storage Service (S3), Amazon CloudFront, AWS Elastic Load Balancer, etc. 

It also analyzes and processes CloudTrail log files and provides billing analytics. Initially built by Blazeclan to help an organization with reliable cloud migration solutions, it has been a phenomenal AWS monitoring tool. 

AWS logs are raw data that provide information of system components and service-based activities recorded in log tables. However, there are several different types of logs like,

  • Operational logs
  • Weblogs
  • Application logs
  • Database logs
  • CDN or Content Delivery Network logs

Analysis and interpretation of log data can help you overcome several business challenges. It also enables business agility, which allows your organization to adapt to the changes in market demand quickly.

Cloudlytics aggregates all your AWS logs, analyzes them, and offers interactive graphical reports. It is a Big Data analytics tool that runs on Amazon Elastic MapReduce, powered by spot instances through a Redis server.  

Thanks to support from major AWS resources, Cloudlytics leverages Amazon Redshift, data warehouse, and others to provide query processing and contextual analytics on log data. Additionally, you get interactive graphics and charts of your AWS log data, making it effective in decision-making.

Now that you know the tools to monitor AWS services, logs and resources, let’s discuss how to execute the monitoring process.

What are the Steps for Successful AWS Resource Monitoring?

You need to consider several aspects like existing infrastructure, compliance, compatibility issues, etc., for AWS cloud monitoring and the introduction of tools to your entire process flow. Pre-assessment of the system and monitoring requirements helps in understanding what the right process flow is. The best way to execute AWS resource monitoring is by using a phased approach.

Phase 1: Pre-assessment of AWS Monitoring Needs

Pre-assessment of monitoring requirements needs answers to vital questions that form the crux of the entire process. These questions are,

  • Where is your network – on-premise or cloud?
  • Do you need a dedicated cloud monitoring system or an on-premise tracking tool?
  • What are your current security and compliance policies?
  • What are the industry regulations and standards that you need to comply with?
  • How can the introduction of a monitoring tool impact your organization and the entire ecosystem?
  • Which are the metrics that you need to monitor?

Phase 2: Strategy for AWS Monitoring

Once you have done the assessment, the next step is to strategize the entire monitoring process. Here, you need to use a tagging mechanism to enhance the monitoring process. A tag helps you organize the log events for segmentation and filtering of data. These tags are metadata that you can set to be easily integrated with any system and transmit data related to an event.

Here is an example of the tags sent through HTTP APIs.

It is essential to understand that you will have to configure one from scratch if you don’t have a tagging system in place. The tagging process can consume some time and effort, but it brings reliability for the monitoring process to work seamlessly. 

Phase 3: The Right Tool

Based on the monitoring requirements and AWS services, you can choose the best tools for the process. While selecting the AWS monitoring tool, you need to check the support for different services. For example, if you are looking for an EC2 monitoring tool, you need to review all the tools available and analyze whether they support Amazon EC2 before choosing one.

Phase 4: Logs Aggregation

Once you select the tool, you have to decide the metrics and logs you want to record or capture. There are several different types of logs, and which one to monitor will depend on the AWS resource.

Now let’s look at some best practices for the AWS monitoring process.

AWS Monitoring Best Practices

Following these AWS monitoring best practices ensure higher efficiency and better performance of the resources.

Automation

Every log has massive structured and unstructured data that can be a daunting task to monitor. One of the best ways to deal with this BigData problem is to use Cloudlytics or integrate automation. For example, you can use Database Attribute Recommendation algorithms to simplify unstructured data for the AWS cloud monitoring process. 

Prioritizations

Prioritize the monitoring process for specific services based on your operational requirements. Monitoring in real-time is crucial to your core services. It can help you reduce downtime and offer high availability. 

Testing & Verifying

The best way to ensure that the changes you apply are based on the monitoring analytics is to test each configuration. Testing the configurations and verifying them allows you to avoid any downtime or loss of data.

Conclusion

AWS monitoring tools are a great way to ensure that you get the maximum output from cloud-based services while maintaining industry norms. However, you need to first figure out the right tool and strategize the entire process for monitoring efficiency.

We hope the above list of tools assisted you with your monitoring tasks. If you have a particular interest in AWS and are looking for more resources, we suggest you check out some of the articles we’ve written on our blog.

We are now live on AWS Marketplace.
The integrated view of your cloud infrastructure is now easier than ever!