

FinOps Agent tells you a cost anomaly happened. This architecture tells you whether your unit economics are improving as you scale — the question a DNB’s board actually asks.
A digital native business rarely gets asked “why did AWS spend go up 12% last month.” It gets asked “is cost per customer going down as we grow.” Those are different questions requiring different architecture — anomaly detection catches spikes, but it says nothing about whether the underlying unit economics of the business are trending the right direction.
1. The Architecture
The foundation is cost allocation tagging applied consistently at the resource level — by team, by feature, by customer-facing service — which only works if enforced at provisioning time, not retrofitted after the fact. Cost and Usage Report 2.0 exports that tagged usage data at the granularity needed to join it against business events. Athena or Redshift is where that join actually happens: cost data on one side, transaction counts, active customers, or orders on the other, correlated by timestamp and account/tag dimensions.
The output is a QuickSight dashboard measuring cost per transaction, cost per customer, or cost per order — not cost per account, which is the metric every default AWS billing view gives you and the one that tells a growth-stage business almost nothing useful.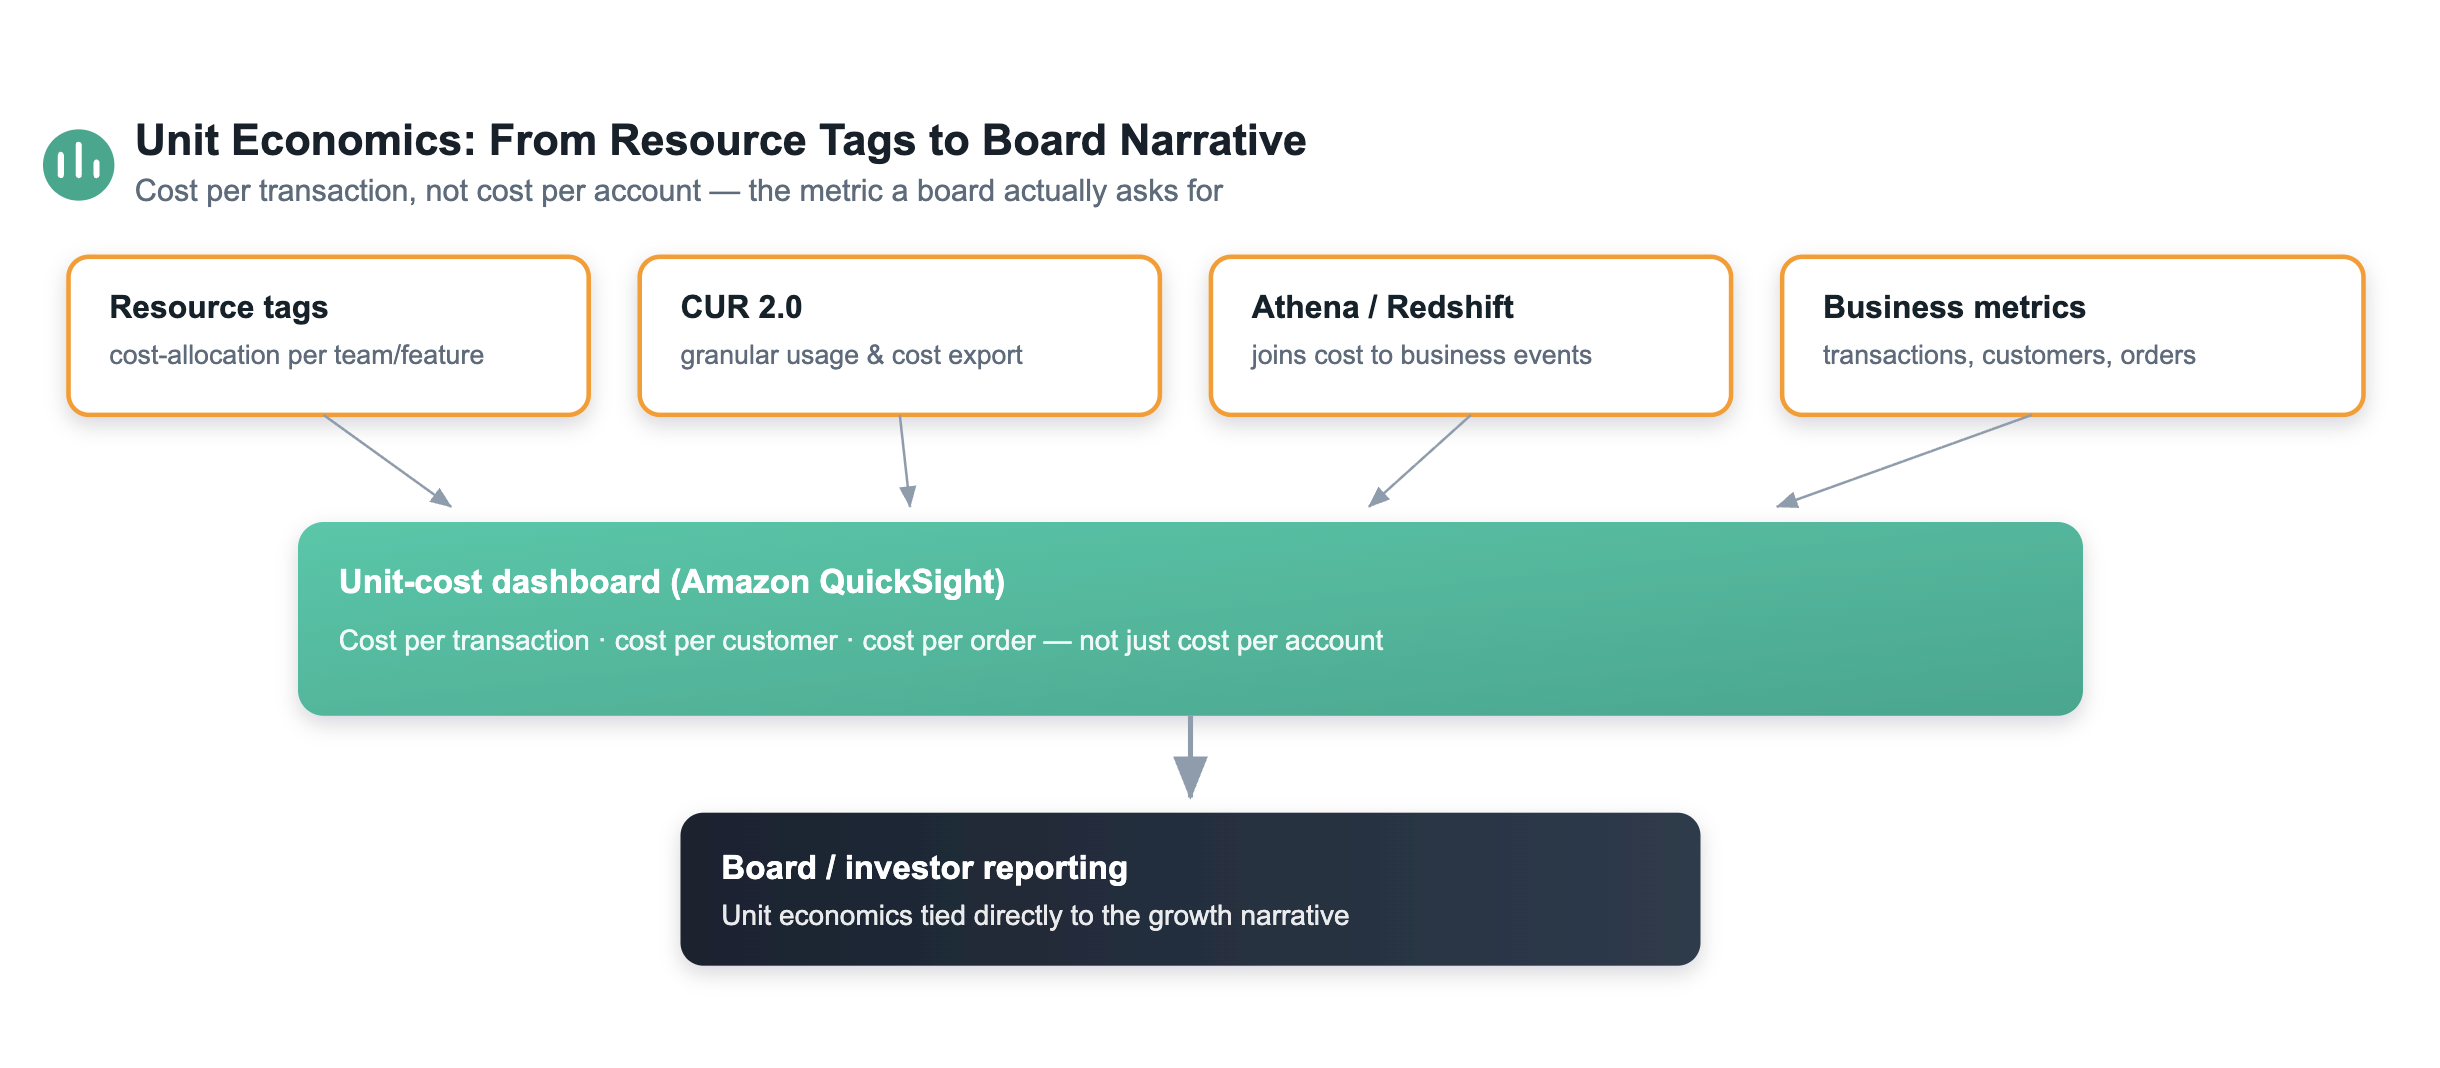
Technical deep-dive — the join that makes this work. The Athena query joining cost to business events is the load-bearing artifact in this architecture, and it only works if tags are enforced at provisioning (via SCP or a tagging policy in the landing zone), not applied retroactively:
SELECT
  DATE_TRUNC('day', line_item_usage_start_date) AS usage_day,
  resource_tags_user_feature AS feature,
  SUM(line_item_unblended_cost) AS daily_cost,
  SUM(daily_cost) / NULLIF(SUM(txn.transaction_count), 0) AS cost_per_transaction
FROM cur_2_0 AS cur
JOIN business_transactions AS txn
  ON DATE_TRUNC('day', cur.line_item_usage_start_date) = txn.transaction_day
 AND cur.resource_tags_user_feature = txn.feature_tag
GROUP BY 1, 2
The output is not a cost report — it is a growth-efficiency metric that moves in the opposite direction cost usually moves: a healthy DNB shows cost-per-transaction trending down even as total AWS spend trends up, because volume is scaling faster than infrastructure cost. That inversion is the actual board-level insight this architecture exists to produce.
2. Where This Connects to Agentic AI
The natural extension is correlating cost anomalies with deployment and telemetry events — the same entity-resolution problem this series’ earlier observability work depends on. When a unit-cost dashboard shows cost-per-transaction spiking, the useful next question is what changed: a deployment, a traffic pattern shift, a dependency’s pricing change. FinOps Agent’s anomaly investigation, pointed at unit-cost data rather than raw account spend, is where this architecture and FinOps Agent converge into one practice rather than two separate deliverables.
3. Productizing the Practice
This is squarely a DNB-first offering, but it scales upward: DNB clients buy it as a standalone unit-economics-as-a-service package, delivered as a recurring board deck generated automatically from the dashboard. SMB clients typically adopt a lighter version — cost per customer only, without the full transaction-level breakdown. Enterprise clients usually already have some version of this internally, so the sale becomes replacing a hand-maintained spreadsheet pipeline with a managed, tag-enforced, automatically refreshed one.
What changes for the SI partner
This is one of the few offerings in this series that sells directly to a CFO or board audience rather than to engineering or platform teams — which means the sales conversation, the deliverable format (a board deck, not a dashboard link), and the renewal cadence (quarterly, tied to board meeting cycles) all look different from the rest of the series. Price it as a reporting product, not an infrastructure engagement.
Business Value Mapping
| Technical capability | Business outcome | Metric / KPI | Primary stakeholder |
|---|---|---|---|
| Enforced cost-allocation tagging at provisioning | Cost data is queryable at the business-unit level from day one | % of spend with complete tag coverage | Platform engineering |
| CUR 2.0 joined to business transaction events | Cost visibility tied to growth metrics, not just infrastructure line items | Cost per transaction / customer / order trend | CFO / board |
| Automated QuickSight unit-cost dashboard | Replaces a hand-maintained spreadsheet pipeline | Analyst hours saved per reporting cycle | FinOps / finance |
| Automated board-deck generation | Growth-efficiency story ready for every board cycle without a scramble | Time to produce board materials | CEO / board |
| Correlatable with FinOps Agent anomaly investigation | Cost-per-transaction spikes traced to a specific cause, not just observed | % of unit-cost anomalies root-caused | Engineering + finance jointly |
Cost per account answers an accountant’s question. Cost per customer answers a board’s question — and only one of those is worth presenting in a fundraising deck.
Sources: AWS Cost and Usage Report 2.0 documentation · AWS cost allocation tagging best practices (AWS documentation) · AWS FinOps Agent, root-cause analysis capability.